Trillion Dollar Market Caps: Fairy Tale Pricing or Business Marvels?
Stock markets have always rewarded winners with large capitalizations, and with each new threshold, the questions begin anew of whether animal spirits or fundamentals are driving the numbers. A few weeks ago, Nvidia seemed unstoppable as its market capitalization crested $5 trillion, and while markets have turned skeptical since, the core questions have not gone away, and the answers come from two extremes. At one end are the “realists”, who view themselves as rational, above the fray and entirely data-driven, who argue that there is no business model that can support a value this high, and that Nvidia is overvalued. At the other end are the “AI true believers”, who believe that if the market the company is going after is big enough, and they see AI as such a market, the upper bounds on value are released, the sky is the limit. As someone who entered the Nvidia sweepstakes early (in 2018) and has held it through much of its magical run, while expressing reservations about its pricing running ahead of its value, especially in the last three years, I will try to thread the needle (unsuccessfully, I am sure) in this post. In fact, rather than try to convince you that the company is under or overvalued, which is really your judgment to make, I will offer a simple model to reverse engineer from any given market capitalization, the revenues and profitability thresholds you have to meet, and allow you to come to your own conclusions.
A History of Market Cap Thresholds
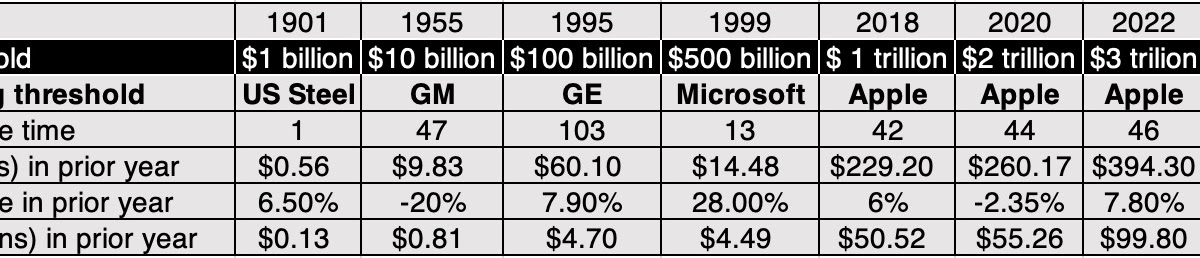
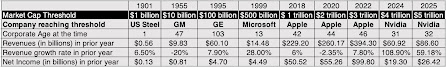
In 1901, US Steel was created when Andrew Carnegie and J.P. Morgan consolidated much of the US steel business, with an eye to monopolizing the steel business, and the company became the first global firm with a market capitalization of a billion dollars, a small number in today’s terms, but a number that was three times larger than the Federal budget in that year. The twentieth century was a good one for the US economy and US stocks, and the thresholds for highest market cap rose along the way:

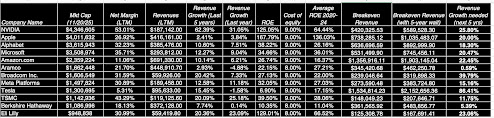
- Substance: To get a measure of operating substance, I looked at the revenues and net income in the year leading into the year in which each company broke through the threshold. As you can see, US Steel had revenues of $0.56 billion and net income of $0.13 billion in 1901, the year in which its market cap exceeded $1 billion. GM, at the time its market cap breached $10 billion, had revenues of $9.83 billion, on which it generated net income of $0.81 billion; if PE ratios are your pricing metric of choice, that would have translated into a PE ratio of 12.35. Between 2018 and 2022, as Apple’s market cap tripled from $1 trillion to $3 trillion, its annual revenues increased by 72%, and its net profits almost doubled. Finally, coming to Nvidia, the surge in market cap to $4 trillion in 2024 and $5 trillion in 2025 has come on revenues and net income that are about a quarter of the size of Apple’s revenues and net income.
- Life cycle: Every company that climbed to the top of the market cap tables and hit a market cap threshold historically has had single-digit revenue growth in the year leading up, with two exceptions: Microsoft in 1999, which was coming off a 28% revenue growth rate in 1998, and Nvidia in both 2024 and 2025 coming off even higher growth rates. Using this revenue growth rate in conjunction with the ages of the companies involved, I think it is fair to conclude that there has been a shift across time, with the mature companies (older, lower growth) that were at the top of the list for much of the twentieth century to much younger companies with growth potential rising to the top in this one.
- Investment returns: Looking at the returns in the years after these companies hit their market cap thresholds, the results are mixed. While buying Apple in 2018, 2020, or 2022 would have yielded winning returns, at least over the next year or two, buying Microsoft in 1999 would not. In some of these cases, extending the time horizon would have made a difference, for the positive with Microsoft and for the negative with GE.
Market Caps: Pathways to Intrinsic Value Break Even
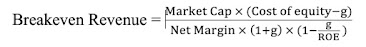
Debates about whether a company is worth what it is trading for, whether it be a billion, ten billion, a hundred billion, or a trillion, devolve into shouting matches of “he said, she said”, with each side staking out divergent perspectives on value and name-calling the other. Having been on the receiving end of some of that abuse, I decided to take a different pathway to examining this question. Rather than wonder whether Nvidia is worth five trillion or Eli Lilly is worth a trillion, I framed the question in terms of how much Nvidia or Eli Lilly would have to generate in revenues to justify their market capitalizations. The reason for my focus on revenues is simple since it is relatively unaffected by accounting games and can be compared to the total market size to gain perspective.

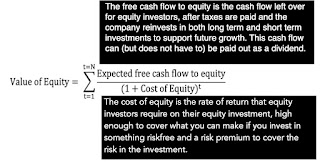
To simplify the assessment further, I structured this model to value equity in a mature company, i.e., one growing at or below the nominal growth rate of the economy in the very long term and again for simplicity, assumed that it could do this forever. The value of equity in this mature, long-lasting firm can be written as follows:

To put this model into use, let’s take the $5 trillion dollar market capitalization that Nvidia commanded a few weeks ago and assign the following general inputs:
- Cost of equity: Every month, I estimate the implied cost of equity for the S&P 500, and that number is model-agnostic and driven by what investors are willing to pay for stocks, given their fears and hopes. At the start of November 2025, that number was about 8%, with higher required returns (9-12%) for riskier stocks and lower expected returns (6-7%) for safer stocks.
- Inflation rate: While inflation has come down from its 2022 highs, it has stayed stubbornly above 2%, which the Fed claims as its target, and it seems more realistic to assume that it will stay at 2.5%, which is consistent with the riskfree rate being about 4%.
- Stable growth rate (nominal growth rate in the economy): This is a number that is in flux, as economists worry about recessions and economic growth, but since this is a long-term number that incorporates expected inflation, it seems reasonable to assume an expected nominal growth of 4% for the economy (about 1.5% real growth).
Since Nvidia is still growing and you may need to wait, as equity investors, to get your cash flows, this breakeven number will get larger, the longer you have to wait and the lower the cash yield that equity investors receive during the growth period. In fact, with Nvidia, if you assume that it will take five years for them to grow to steady state, and that equity investors will receive a cash yield (cash flow as a percent of market cap) of 2% a year, the estimated breakeven revenue increases to $677.97 billion. The table below maps out the effects of waiting on breakeven revenues for a range of cash yield:
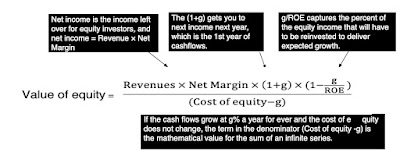
If, as seems reasonable, you assume that net margins and return on equity will decrease over time, the revenues you would need to break even will expand:
In fact, if you are a low-margin company, with net margins of 5% (as is the case with even the very best-run discount retailers) and a more modest return on equity of 10%, you will need revenues of $8 trillion or more to be able to get to a market capitalization of $5 trillion.
This framework can be used to compute breakeven revenues at other firms, and in the table below, we do so for the twelve largest market cap companies in the world, at their market capitalizations on November 20, 2025:

From Breakeven Revenues to Investment Action
While some are more comfortable replacing conventional intrinsic valuation, where you estimate value and compare it to price, with a breakeven assessment, the truth is that the two approaches are born out of the same intent.
The Economics of Breakeven Revenues
The model that I used to compute breakeven revenues is a vastly simplified version of a full equity valuation model, but even in its simplified form, you can see the drivers of breakeven revenues.
- Market Capitalization: Since we work back from market capitalization to estimate breakeven revenues, the larger the market capitalization, holding all else constant, the greater the breakeven revenues will be. Using just Nvidia as an example, the company has seen its market capitalization rise from less than $400 billion in 2021, to $1 trillion in 2023, $2 trillion and $3 trillion thresholds in 2024 and crossed the $4 trillion and $ 5 trillion market cap levels in 2025. As the market cap has risen, the breakeven revenues have increased from $200 billion at the $1 trillion mark to $600 billion at the current market cap.
- Operating Profitability: There are two profitability metrics in the drivers, with net margins determining how much of the revenues a company can convert to profits and the return on equity driving the reinvestment needed to sustain growth. Higher profitability will allow a company to deliver a higher market capitalization, at any given level of revenues. One reason manufacturing firms like Tesla will need higher breakeven revenues than software firms is that the unit economics are not as favorable.
- Interest rates and equity risk premiums: The level of interest rates and equity risk premiums determine the cost of equity for all company, with higher values for the latter pushing up the costs of equity for riskier companies higher, relative to safer companies.
- Operating and leverage risk: The riskiness in a business will push its cost of equity higher, and a higher debt load (relative to market cap) will have the same effect. A higher cost of equity will raise the breakeven revenues needed to deliver the same market capitalization.
In sum, while the breakeven revenue that you need to justify a given market cap always increases as the market cap increases, its level and rate of rise will be governed by business economics.
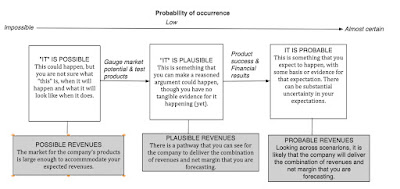
The 3Ps: Possible, Plausible, and Probable

It is possible that once you compute the breakeven revenues for a firm and measure it up against reality that it is impossible, i.e., a fairy tale. The most obvious case is when the breakeven revenues that you compute for your firm exceeds the total market for the products or services that it provides. If there is a lesson that tech companies learned in the last decade, it was in making the total addressable market (TAM) for their market into almost an art form, adding zeros and converting billion dollar markets into trillion dollar TAMs. If you pass the “it is possible” test, you enter the plausibility zone, and nuance and business economics enter the picture more fully. Thus, assuming that a luxury retailer with sky-high margins and small revenues, by staying with a niche market, can increase its revenues ten-fold, while keeping margins intact, is implausible, as is a net margin of 40% in stable growth for a company with gross margins that are barely above that number. Finally, assuming that revenues can multiply over time, without reinvesting in acquisitions or projects to deliver those revenues are also pushing the boundaries of what is plausible. Once breakeven revenues pass the possible and plausible tests, you should be on more familiar ground as you look at the entire story line for the company, and assess whether the combination of growth, profitability and reinvestment that you are assuming with your story has a reasonable probability of being delivered.
To apply these tests, consider Nvidia and Tesla. Nvidia needs about $590 billion in revenues by 2030 to break even at its current market capitalization of $4.3 trillion, requiring a growth rate in revenues of about 26% for the next five years. While that is a reach, it is both possible and plausible, with continued growth in the AI chip market and a dominant market share for Nvidia providing the pathway. It is on the probable test that you run into headwinds, since competition is heating up, and that will put pressure on both growth and margins. The problem for Tesla is that if the net margin stays low (at 5.31%), the revenues needed to breakeven exceed $2.2 trillion, and even with robotics and automated driving thrown into the business mix, you are pushing the limits of possibility. A Tesla optimist, though, would argue that these new businesses, when they arrive, will bring much higher net margins, which, in turn, will push down breakeven revenues and bring it into plausible territory.
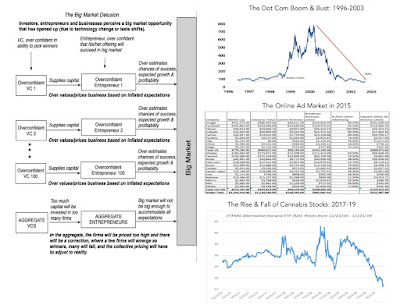
The Aggregated 3P Test – Big Market Delusion

The AI storyline clearly fits the big market delusion. There is talk of a “huge” market for AI products and services, with little to show as tangible evidence of that market’s existence right now, and that potential has drawn massive investments in AI architecture from tech companies. Along the way investors have also fallen under the spell of the big market, and have pushed up the market capitalizations of almost every company in the space. Using the language of breakeven revenues, investors in each of these companies is attributing large breakeven revenues to their chosen companies, but the delusion comes from the reality that if you aggregated these breakeven revenues across companies, the market is not big enough to sustain all of them. In short, each company passed the possible and plausible test, but in the aggregate, you are chasing an impossible target.
The Management Effect
The mechanics of the breakeven revenue process may make it seem like managers are bystanders in the process and that investing can be on autopilot, but they are not. In fact, when market capitalizations rise, and breakeven revenues run well ahead of current revenues, I would argue that management matters more than ever. Going back to the breakeven revenues that we computed for the twelve largest market cap companies in the world, I would make the case that management matters much less (if at all) in Aramco and Berkshire Hathway, where breakeven revenues are close to current revenues, and the investments needed to deliver those revenues have already been made, that at the companies that still have steep climbs ahead of them to get to breakeven revenues.
The Investing Bottomline
I started this post with mentions of market cap thresholds being breached, as the market pricing pushes up into the trillions for some of the biggest stock market winners. But what are the implications for investors?
- Highly priced ≠ Overpriced: If you are an investor who considers any highly priced company to be overvalued, I hope that this post leads you to reconsider. By reframing a pricing in terms of breakeven revenues, profitability and reinvestment, it allows you to consider whether a stock, even if priced at $4 trillion, may still be a good buy.
- The 3P test: Once you compute the operating metrics you need to breakeven on an investment in a highly priced company, passing those metrics through the 3P test (Is it possible? Is it plausible? Is it probable?) allows you to examine each company on its merits and potential, rather than use a broad brush or a rule of thumb (based on PE ratios or revenue multiples).
- Room to disagree: I have never understood why, even if you believe strongly that a stock is over or under priced, that you need to evangelize that belief or contest people with alternate views. I think that the pathway that you would need (in terms of revenue growth and profitability) to justify Nvidia’s and OpenAI’s current pricing is improbable, but that is just my view, and it is entirely possible that you have an alternate perspective, leading to the conclusion that they are undervalued.
- Reality checks: No matter what your view, optimistic or pessimistic, you have to be open to changing your mind, as you are faced with data. Thus, if you have priced a company to deliver 20% growth in revenues over the next five years (to break even) and actual revenues growth comes in at 10%, you have to be willing to revisit your story, admit that you were wrong, and adapt.
If you came into this post, expecting a definitive answer on whether Nvidia is overpriced, you are probably disappointed, but I hope that you use the breakeven spreadsheet to good effect to make up your own mind.
YouTube
Spreadsheets
Source link