S&P 500 Faces Brutal February – Here’s Why the Market is Spiraling!

The U.S. stock markets are witnessing a significant downturn, with President Donald Trump’s tariff policies sending shockwaves through equities. The Nasdaq Composite is on track for its worst weekly performance since 2023, while the S&P 500 faces its most challenging February since 2020. The market sell-off stems from three major economic concerns: mounting pressures on corporate earnings, constraints on economic growth, and heightened uncertainty surrounding trade policies. Investors are growing increasingly wary as these factors compound, leading to broad-based declines across key indices.
Direct Market Impacts of Tariffs
The technology sector, which has long been a market leader, is facing pronounced vulnerability. On February 28, the Nasdaq declined by 0.3%, largely driven by an 8.5% drop in Nvidia’s stock following its earnings report. The sharp decline underscores investor concerns regarding global technology supply chains, particularly as semiconductor firms face rising input costs due to Chinese retaliatory tariffs. The fear of further disruptions in the trade landscape is pressuring investors to reassess growth prospects for major chipmakers and other technology firms.
The broader market has not been immune to these shocks. The S&P 500 has suffered a 3% decline in February alone, while the Dow Jones Industrial Average has lost approximately 2.9%. In just one week, the S&P 500 experienced three separate daily declines exceeding 1%, signaling growing apprehension about the sustainability of corporate earnings under the weight of new trade restrictions.
Another key trend emerging from the market turmoil is sector rotation. Companies with heavy international trade exposure have been particularly hard-hit, as investors move away from stocks vulnerable to supply chain disruptions and retaliatory tariffs. Conversely, domestically focused firms have fared better, as their revenue streams are largely insulated from direct trade tensions. This divergence highlights the extent to which trade policy is dictating capital flows across different market segments.
Economic Mechanisms of Tariff Damage
The impact of tariffs extends beyond market performance, exerting downward pressure on corporate earnings. Goldman Sachs estimates that every 5% increase in tariffs results in a 1-2% reduction in S&P 500 earnings per shareEarnings per share (EPS) is a fundamental financial metric that provides valuable insights into a company’s profitability. This widely used indicator helps investors and analysts g… (EPS). Given the current tariff proposals, the firm warns of a potential 2-3% decline in overall S&P 500 EPS. Such projections highlight the strain on profitability for multinational corporations, particularly those dependent on cross-border trade.
The automotive sector remains particularly vulnerable. A 25% tariff on motor vehicles and parts could lower U.S. gross domestic product (GDP) by 0.1% and eliminate 81,000 jobs. Automakers that rely on international supply chains are now grappling with the prospect of increased costs, which could erode margins and force price hikes that dampen consumer demand.
The technology sector faces additional margin risks, particularly for semiconductor firms. Chinese tariffs on critical inputs are poised to raise production costs, while export-dependent manufacturers are likely to see weakened global demand. The dual pressures of higher costs and reduced sales potential are putting significant strain on growth-oriented companies in the sector, further exacerbating market volatility.
The macroeconomicAt its core, macroeconomics is the branch of economics that examines the behavior, performance, and structure of an economy as a whole. Unlike microeconomics, which focuses on indi… effects of tariffs also extend to broader economic indicators. GDP growth is expected to suffer, with proposed tariffs on Canada and Mexico potentially reducing long-run GDP by 0.3%. Additional tariffs on Chinese imports could contribute another 0.1% contraction, further slowing economic expansion.
Inflationary pressures are another growing concern. Tariffs on over $380 billion worth of imports threaten to push consumer prices higher, counteracting recent signs of cooling inflationInflation refers to the rate at which the overall price levels of goods and services increase, gradually reducing purchasing power over time. It is commonly measured using indices …. The core personal consumption expendituresPCE stands for Personal Consumption Expenditures. It is a measure of how much money households spend on goods and services. (PCEPCE stands for Personal Consumption Expenditures. It is a measure of how much money households spend on goods and services.) index, which eased to 2.6%, now faces renewed upward pressure as businesses pass higher costs onto consumers.
Employment projections are also worrisome. Models from the Tax Foundation suggest that tariffs on North American trade could lead to 269,000 job losses, while the auto sector tariffs alone could cost 81,000 jobs. The negative impact on employment growth could further constrain consumer spending, compounding the economic slowdown.
Amplified Market Uncertainty and Investor Anxiety
Beyond direct economic impacts, the ongoing trade disputes are amplifying market uncertainty. The U.S. Economic Policy Uncertainty Index surged to 502 on February 25, a level historically associated with a 3% contraction in price-to-earningsThe price-to-earnings ratio, often abbreviated as P/E ratio, is a fundamental metric used by investors and analysts to evaluate the relative value of a company’s shares in the stoc… (P/EThe price-to-earnings ratio, often abbreviated as P/E ratio, is a fundamental metric used by investors and analysts to evaluate the relative value of a company’s shares in the stoc…) multiples. This level of uncertainty has made it difficult for businesses to plan long-term investments, particularly in sectors reliant on global trade.
Supply chain disruptions are adding another layer of complexity. Many manufacturers now face the dilemma of whether to absorb higher input costs, which would hurt profit marginsIn the dynamic world of business, profitability is a fundamental metric that encapsulates a company’s ability to generate earnings from its operations. Profit margins, expressed as…, or pass these costs onto consumers, which could lead to reduced sales. The uncertainty surrounding supply chains is pushing companies to reconsider their long-term sourcing strategies, potentially leading to shifts in production and procurement policies.
The riskIn stock and crypto trading, risk refers to the possibility of losing some or all of the capital invested in a trade. It represents the uncertainty about the future performance of … of international retaliation is also mounting. Canada and Mexico have already announced reciprocal tariffs, further complicating trade dynamics for U.S. businesses operating in these markets. Meanwhile, China has opted to maintain existing trade barriers, heightening tensions and increasing risks for firms engaged in cross-border commerce.
Historical Context and the Present Risks
Comparing the current trade policies to the previous round of tariffs imposed during the 2018-2020 period reveals stark differences. While Trump’s earlier tariffs led to a 0.2% decline in GDP, the new proposals are far more aggressive in scope and severity. The planned 25% tariffs on Canada and Mexico, compared to the previous 10%, pose a greater threat to trade stability. Additionally, the inclusion of the auto sector in the new round of tariffs broadens the impact across multiple industries.
The global economic landscape is also more fragile today than it was in 2018. A survey of economists indicates that 72% warn of escalating global trade barriers if the current trends continue. The riskIn stock and crypto trading, risk refers to the possibility of losing some or all of the capital invested in a trade. It represents the uncertainty about the future performance of … of cascading protectionist measures could significantly alter the global trade framework, creating long-term consequences for economic growth and corporate profitability.
Another critical difference is the concentration of market leadership. The so-called “Magnificent Seven” stocks—Apple, Microsoft, Amazon, Nvidia, Alphabet, Meta, and Tesla—now account for 30% of the S&P 500. This heightened market concentration means that sector-specific shocks, particularly in technology, have an outsized impact on overall market performance. As a result, tariff-related disruptions in key industries are having a disproportionate effect on index movements.
SPY Trading Plan
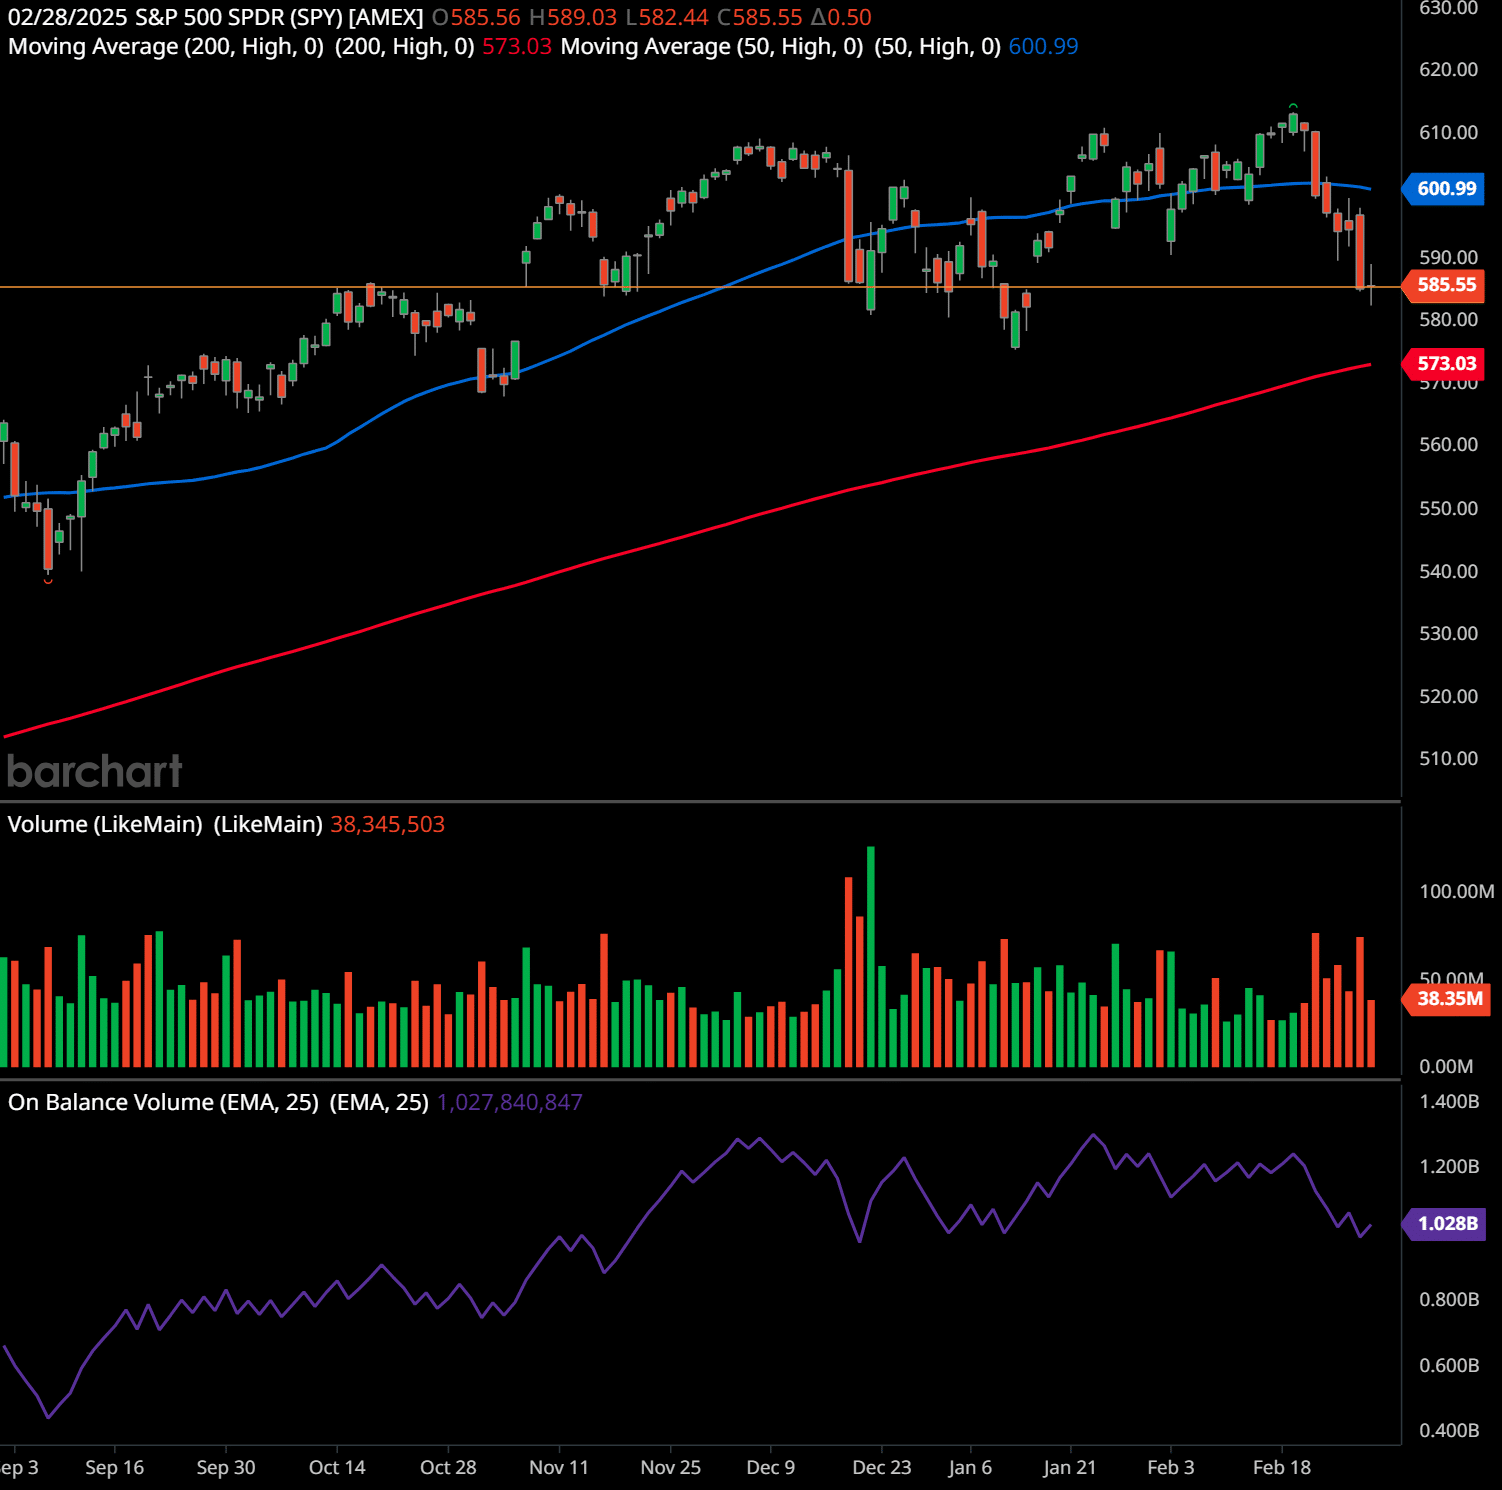
The chart provided is the daily chart of the S&P 500 SPDR ETF (SPY) as of February 28, 2025. The price action shows a decline toward a key support level, along with critical moving averagesThe concept of moving averages dates back to the early 20th century. While it is challenging to attribute the invention of moving averages to a single individual, W. P. Hamilton, a… and volume data that provide insight into market sentiment and future potential movements.
Support and Resistance Levels
- Support: Around $585 is a key horizontal support level that has acted as a floor for recent price action. Below this, the 200-day moving averageThe concept of moving averages dates back to the early 20th century. While it is challenging to attribute the invention of moving averages to a single individual, W. P. Hamilton, a… (200-SMA) at $573.03 serves as the next significant support. A break below the 200-SMA could trigger further selling pressure.
- Resistance: The 50-day moving averageThe concept of moving averages dates back to the early 20th century. While it is challenging to attribute the invention of moving averages to a single individual, W. P. Hamilton, a… (50-SMA) at $600.99 is an immediate resistance level. Additionally, the recent highs near $610-$615 are a stronger resistance zone where selling has occurred in the past.
Future Trend Indications
- The chart suggests that SPY is in a corrective phase, recently testing key support at $585 and approaching the 200-day moving averageThe concept of moving averages dates back to the early 20th century. While it is challenging to attribute the invention of moving averages to a single individual, W. P. Hamilton, a… at $573.
- The downward price action and break below the 50-SMA suggest weakening bullish momentumMomentum in stock trading refers to the rate of acceleration of a stock’s price or trading volume. It indicates the strength of a trend and measures how quickly prices are rising o….
- If the price holds above $585 and rebounds, a retest of the $600-$610 range is possible. However, a break below $573 could lead to a more extended decline.
Chart Patterns and Psychology
- Potential Head and ShouldersThe head and shoulders chart pattern is a technical analysis tool used in stock trading. It is one of the most well-known and widely recognized chart patterns, and it is used by in… Pattern: The price action resembles a head-and-shoulders pattern, where recent highs indicate a possible topping formation. If the neckline around $585-$580 breaks, it could signal further downside.
- Trader PsychologyTrader psychology refers to the emotions and mental states that influence a trader’s decision-making process in financial markets. Emotions such as fear, greed, hope, and regret …: The market is currently at a psychological inflection point. Bulls are trying to defend the $585 support, while bears are attempting to push the price lower. Increased volume on down days suggests that sellers are in control in the short term.
Indicator Analysis
- Moving AveragesThe concept of moving averages dates back to the early 20th century. While it is challenging to attribute the invention of moving averages to a single individual, W. P. Hamilton, a…: The 50-SMA is sloping downward, indicating short-term bearish momentumMomentum in stock trading refers to the rate of acceleration of a stock’s price or trading volume. It indicates the strength of a trend and measures how quickly prices are rising o…, while the 200-SMA is still rising, suggesting the long-term trend remains intact.
- Volume: Recent volume spikes on down days indicate increased selling pressure, a warning sign for further downside riskIn stock and crypto trading, risk refers to the possibility of losing some or all of the capital invested in a trade. It represents the uncertainty about the future performance of ….
- On Balance VolumeThe On Balance Volume indicator (OBV) is a technical analysis tool used to measure the flow of money into and out of a security over a specified period of time. It is a cumulative … (OBVThe On Balance Volume indicator (OBV) is a technical analysis tool used to measure the flow of money into and out of a security over a specified period of time. It is a cumulative …): OBVThe On Balance Volume indicator (OBV) is a technical analysis tool used to measure the flow of money into and out of a security over a specified period of time. It is a cumulative … has been declining slightly, suggesting weakening buying pressure. This aligns with the price decline, reinforcing bearish sentiment.
Stock Price Forecast
- Bullish Case: If SPY holds support at $585 and bounces back above $600, it could attempt another move toward recent highs of $610-$615.
- Bearish Case: A break below $573 (200-SMA) would indicate further weakness, possibly leading to a decline toward $560 or lower.
Trading Plans
Swing TradingSwing trading is a popular trading strategy aimed at capturing short- to medium-term gains by taking advantage of price swings in financial markets. Unlike day trading, which invol… Plan:
- Entry: Buy near $585 support if there are signs of a reversal (e.g., bullish candlestickCandlestick chart patterns are visual representations of price movements in financial markets, typically stocks, commodities, or currencies, during a specific time period. Each “ca… pattern, increased volume).
- Stop Loss: Set a stop below $573 to limit downside riskIn stock and crypto trading, risk refers to the possibility of losing some or all of the capital invested in a trade. It represents the uncertainty about the future performance of ….
- Profit Target: First target around $600 (50-SMA), then $610 if momentumMomentum in stock trading refers to the rate of acceleration of a stock’s price or trading volume. It indicates the strength of a trend and measures how quickly prices are rising o… continues.
Long-Term Trading Plan:
- Entry: Accumulate near the 200-SMA ($573) if price stabilizes, considering a long-term uptrend is still intact.
- Stop Loss: Below $560 if market sentiment deteriorates.
- Profit Target: Hold for a potential retest of $615-$620 and beyond.
Past performance is not an indication of future results. This article should not be considered investment advice. Always conduct your own research and consider consulting with a financial advisor before making any investment decisions. 🧡
Outlook for Investors Amid Trade Turbulence
JPMorgan’s Marko Kolanovic has compared the current market environment to 2018, characterized by heightened volatility and lower valuations. However, he notes that the present circumstances introduce additional complexities, including a Federal Reserve constrained by conflicting pressures of inflationInflation refers to the rate at which the overall price levels of goods and services increase, gradually reducing purchasing power over time. It is commonly measured using indices … control and economic growth support. With no immediate resolution to the trade disputes in sight, investors should brace for continued turbulence.
Investors should closely monitor developments in the semiconductor and auto industries, as they remain among the most vulnerable to ongoing trade policy shifts. Companies such as Nvidia, which has already seen a significant stock price decline, will be key indicators of broader market sentiment. Similarly, automakers reliant on global supply chains will serve as bellwethers for the economic fallout of new tariffs.
Until trade policy clarity emerges, market uncertainty will likely persist. The coming months will be critical in determining whether the U.S. economy can withstand the pressures of protectionism or whether prolonged trade conflicts will push markets deeper into correction territory.
Lance Jepsen is the senior personal finance writer for Guerilla Stock Trading who has spent more than 25 years covering the stock market and economics. In addition, Lance has worked as a private stock analyst for a number of high worth individuals.
Trading and Investment Ideas:
Source link