
TSM just broke out of a rectangle pattern! Will the bulls take it to $219 or higher? Watch these key levels 👀
Taiwan Semiconductor Manufacturing Company (TSMC) witnessed a remarkable surge in its stock price on December 23, 2024, climbing 5.15% to close at $207.36. This significant rise is underpinned by a combination of geopolitical developments, financial strength, and burgeoning demand in the artificial intelligence (AI) sector. Investors are increasingly viewing TSMC as a pivotal player in the global semiconductor landscape.
U.S. Trade Investigation into China’s Semiconductor Industry
One of the primary catalystsIn stock trading, a catalyst refers to an event, news, or announcement that causes a significant and often rapid price movement in a stock or the broader market. Catalysts can be p… for TSMC’s stock performance was the announcement of a U.S. trade investigation into China’s semiconductor policies, often referred to as the “Section 301” probe. This investigation targets China’s practices in the “legacy” semiconductor segment and raises the possibility of increased U.S. tariffs on Chinese components.
For TSMC, this development is seen as a potential boon. Reduced competition from Chinese semiconductor manufacturers could strengthen the company’s position in the global market. TSMC, already a dominant player in advanced chip manufacturing, stands to benefit as demand shifts away from Chinese suppliers. Investors are optimistic about the long-term implications of this geopolitical shift, positioning TSMC as a critical beneficiary of these policies.
TSMC’s ability to capitalize on shifting geopolitical dynamics underscores its resilience and strategic importance. With a global semiconductor market valued in the trillions, TSMC is poised to lead amidst trade realignments, making it a compelling choice for investors seeking exposure to this sector.
Strong Financial Performance
TSMC’s robust financial health has further bolstered investor confidence. The company reported stellar results for Q3 2024, with revenue surging by 39% year-over-year to $23.5 billion. Key financial metrics highlighted the company’s operational excellence:
- Gross marginGross margin is a critical financial metric that plays a pivotal role in evaluating a company’s financial health and profitability. It is a percentage that indicates how efficientl… expanded by 4.6 percentage points sequentially, reaching 57.8%.
- Operating marginThe operating margin is a critical financial metric that measures a company’s ability to generate profit through its core operations. It provides valuable insights into a company’s… climbed to an impressive 47.5%, showcasing TSMC’s ability to maintain profitability even amidst rising costs.
These financial milestones reinforce TSMC’s position as a leader in the semiconductor space, attracting institutional and retail investors alike.
Financial strength is a critical indicator of a company’s ability to navigate market volatility. TSMC’s consistent performance, even in challenging environments, signals a reliable investment for those focused on long-term returns.
AI-Driven Demand Fuels Growth
The ongoing AI revolution has become a game-changer for TSMC, driving unprecedented demand for its products. The company plays a pivotal role in manufacturing chips for NVIDIA, the leading provider of GPUs for AI applications. NVIDIA’s server processor revenue has more than tripled in 2024, with TSMC serving as its primary supplier.
This surge in demand is reflected in TSMC’s revenue composition, where AI-related products now account for approximately 15% of the top line. As AI adoption accelerates across industries, TSMC is uniquely positioned to capture this growth, further solidifying its market leadership.
AI’s transformative potential across industries places TSMC at the heart of a major technological shift. By aligning with NVIDIA and other AI leaders, TSMC offers investors direct exposure to the lucrative AI-driven semiconductor market.
Positive Market Sentiment and Analyst Support
Market sentiment towards TSMC remains overwhelmingly positive, with analysts maintaining a bullish outlook. Susquehanna analysts recently reaffirmed their “Positive” rating for the stock, setting a price target of $250 per share. This optimistic forecast highlights the potential for further upside as TSMC continues to outperform expectations.
Year-to-date, TSMC’s stock has surged nearly 75%, reflecting its resilience and growth trajectory. The December 23, 2024, rally further underscores the market’s confidence in the company’s strategic direction and financial health.
Strong analyst support and consistent stock performance position TSMC as a reliable investment. Its leadership in advanced chip manufacturing and alignment with high-growth sectors like AI ensure sustained relevance in investor portfolios.
Taiwan Semiconductor Stock Trading Plan
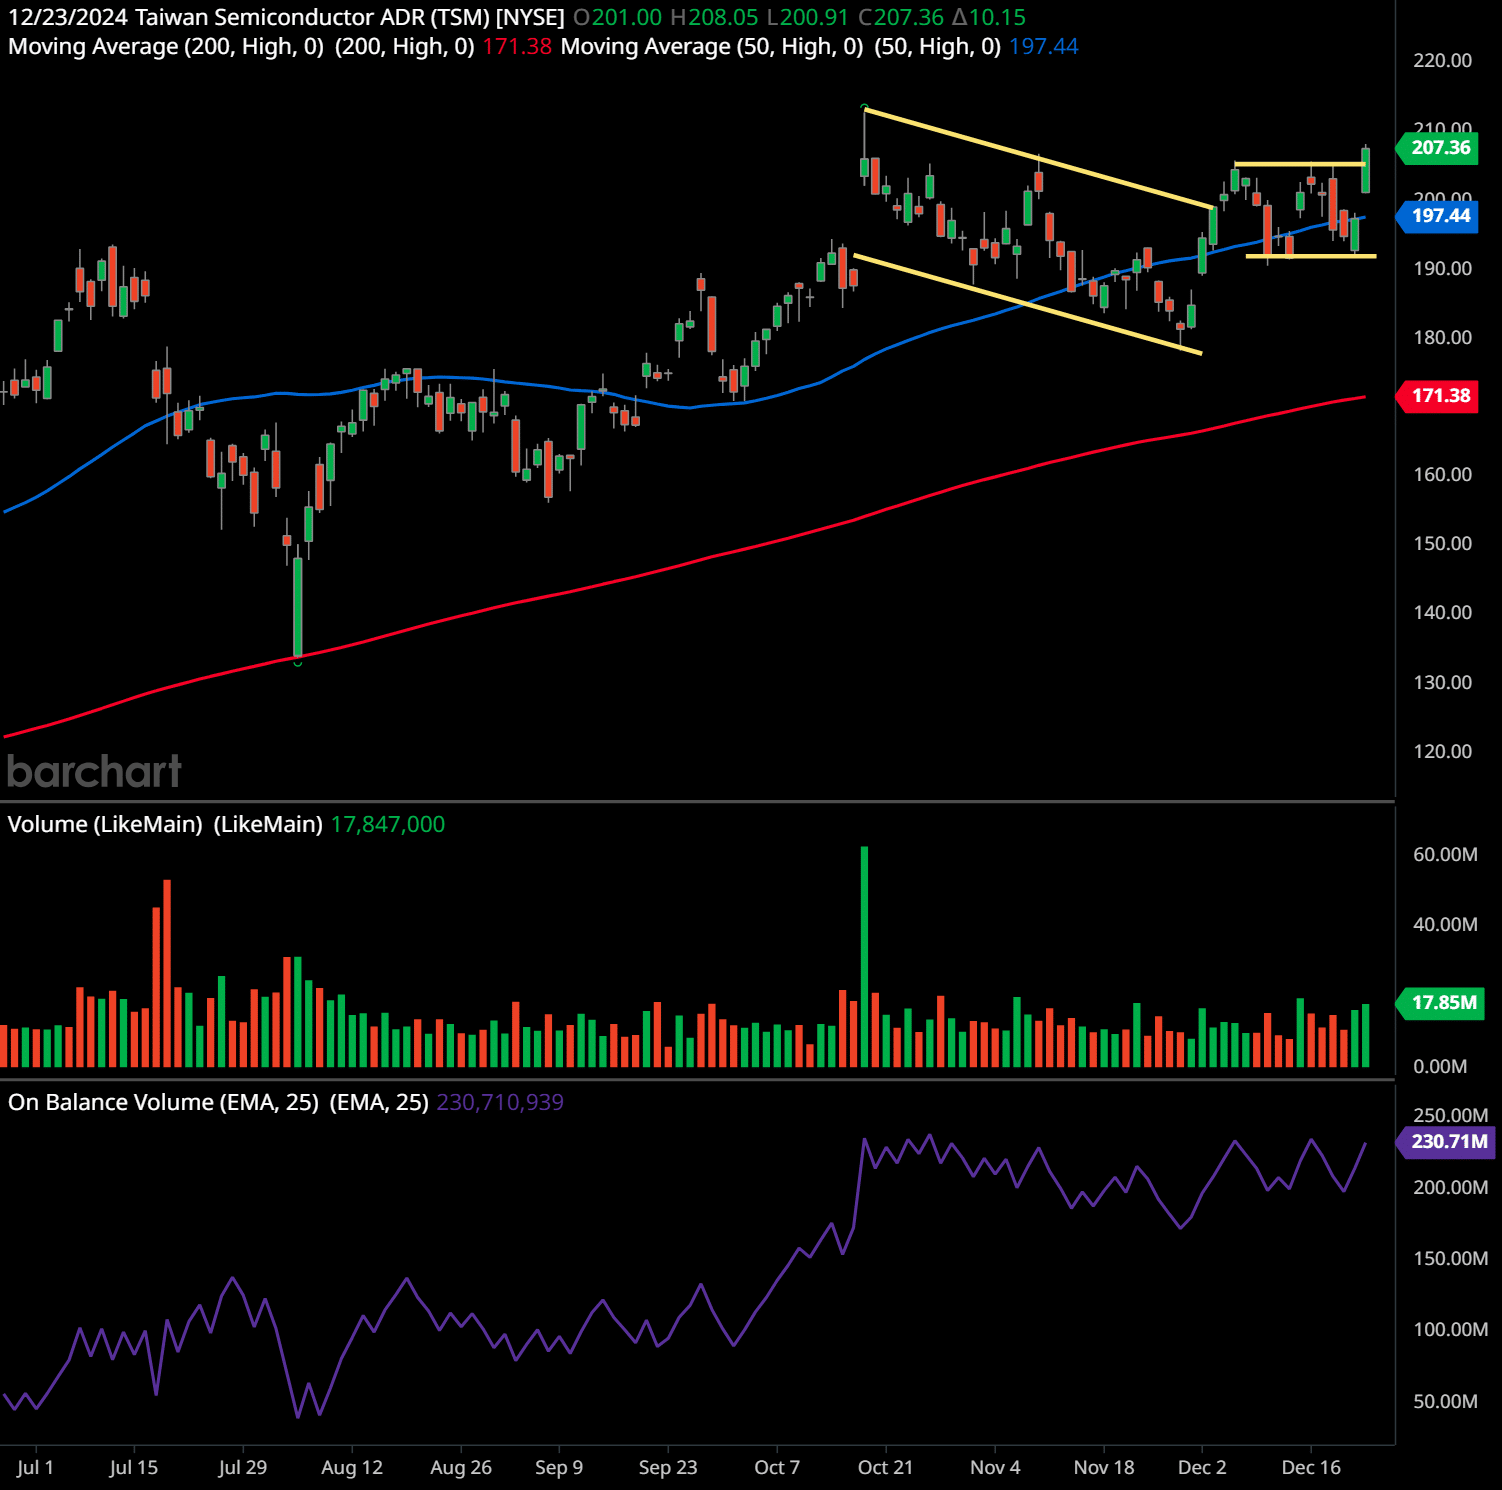
The chart provided is for Taiwan Semiconductor Manufacturing Company (TSM), showing technical indicators on a daily timeframe. Here’s a detailed analysis:
- Support and Resistance Levels:
- Resistance: Around $208, where the stock has tested and slightly broken through the upper bound of the rectangleA rectangle pattern is a continuation chart pattern that occurs when the price moves within a horizontal range, bounded by parallel support and resistance levels. It represents a p… pattern. This may now turn into support if the breakoutBreakout patterns occur when a stock price moves beyond a defined level of support or resistance with increased volume, signaling the potential start of a new trend. A breakout ind… holds.
- Support: $197 (near the 50-day moving averageThe concept of moving averages dates back to the early 20th century. While it is challenging to attribute the invention of moving averages to a single individual, W. P. Hamilton, a…) and $171 (200-day moving averageThe concept of moving averages dates back to the early 20th century. While it is challenging to attribute the invention of moving averages to a single individual, W. P. Hamilton, a…). These are key levels to watch for price pullbacks.
- Chart PatternsChart patterns are visual formations on price charts that occur due to the behavior of buyers and sellers in the market. These patterns often signal potential future price movement…:
- A RectangleA rectangle pattern is a continuation chart pattern that occurs when the price moves within a horizontal range, bounded by parallel support and resistance levels. It represents a p… Pattern is drawn on the chart, highlighting consolidation between approximately $197 and $208. This indicates indecision and balance between buyers and sellers. The recent breakoutBreakout patterns occur when a stock price moves beyond a defined level of support or resistance with increased volume, signaling the potential start of a new trend. A breakout ind… above $208 signals bullish intent and could mark the start of a new uptrend.
- There was also a prior Falling Channel (yellow trendlines) before the stock reversed and broke upward in early November, confirming bullish momentum.
- Trend Analysis:
- The stock is in a strong uptrend, supported by higher lows and higher highs.
- The 50-day moving averageThe concept of moving averages dates back to the early 20th century. While it is challenging to attribute the invention of moving averages to a single individual, W. P. Hamilton, a… ($197.44) is above the 200-day moving averageThe concept of moving averages dates back to the early 20th century. While it is challenging to attribute the invention of moving averages to a single individual, W. P. Hamilton, a… ($171.38), confirming a bullish alignment.
- Price action above the 50-day moving averageThe concept of moving averages dates back to the early 20th century. While it is challenging to attribute the invention of moving averages to a single individual, W. P. Hamilton, a… suggests continued upward momentum.
- Volume and On-Balance VolumeThe On Balance Volume indicator (OBV) is a technical analysis tool used to measure the flow of money into and out of a security over a specified period of time. It is a cumulative … (OBVThe On Balance Volume indicator (OBV) is a technical analysis tool used to measure the flow of money into and out of a security over a specified period of time. It is a cumulative …):
- Volume: A spike in volume occurred during the breakoutBreakout patterns occur when a stock price moves beyond a defined level of support or resistance with increased volume, signaling the potential start of a new trend. A breakout ind…, reinforcing its validity.
- OBVThe On Balance Volume indicator (OBV) is a technical analysis tool used to measure the flow of money into and out of a security over a specified period of time. It is a cumulative …: The rising OBVThe On Balance Volume indicator (OBV) is a technical analysis tool used to measure the flow of money into and out of a security over a specified period of time. It is a cumulative … trend suggests strong accumulation by institutional or large investors, a bullish indicator.
- Indicators and Implications:
- The breakoutBreakout patterns occur when a stock price moves beyond a defined level of support or resistance with increased volume, signaling the potential start of a new trend. A breakout ind… above $208 indicates potential continuation to the upside. If the breakoutBreakout patterns occur when a stock price moves beyond a defined level of support or resistance with increased volume, signaling the potential start of a new trend. A breakout ind… sustains, it may confirm a measured move equal to the height of the rectangleA rectangle pattern is a continuation chart pattern that occurs when the price moves within a horizontal range, bounded by parallel support and resistance levels. It represents a p… (~$11), targeting approximately $219.
- If the breakoutBreakout patterns occur when a stock price moves beyond a defined level of support or resistance with increased volume, signaling the potential start of a new trend. A breakout ind… fails and price re-enters the rectangleA rectangle pattern is a continuation chart pattern that occurs when the price moves within a horizontal range, bounded by parallel support and resistance levels. It represents a p…, expect a re-test of $197 or the 50-day moving averageThe concept of moving averages dates back to the early 20th century. While it is challenging to attribute the invention of moving averages to a single individual, W. P. Hamilton, a….
- Stock Price Forecast:
- Short-term: Bullish, with an expected price target of $219 based on the rectangleA rectangle pattern is a continuation chart pattern that occurs when the price moves within a horizontal range, bounded by parallel support and resistance levels. It represents a p… pattern’s height. Continued bullish sentiment depends on staying above $208.
- Medium to Long-term: If the stock remains above $197 and the 50-day moving averageThe concept of moving averages dates back to the early 20th century. While it is challenging to attribute the invention of moving averages to a single individual, W. P. Hamilton, a…, the bullish trend is intact, potentially moving toward $230.
- Trading Plans:
- Swing Trading Plan:
- Entry: Buy near $208 if the breakoutBreakout patterns occur when a stock price moves beyond a defined level of support or resistance with increased volume, signaling the potential start of a new trend. A breakout ind… holds.
- Stop-loss: Set at $197 to manage downside risk.
- Target: $219 (rectangleA rectangle pattern is a continuation chart pattern that occurs when the price moves within a horizontal range, bounded by parallel support and resistance levels. It represents a p… height) for profit-taking.
- Long-term Trading Plan:
- Entry: Accumulate near $197 (50-day MA) or $171 (200-day MA) during pullbacks.
- Stop-loss: Below $170 to account for a potential trend reversal.
- Target: $230 and beyond, holding for long-term growth based on continued bullish fundamentals and technical alignment.
- Swing Trading Plan:
Past performance is not an indication of future results. This analysis is not investment advice. Always conduct your own research and consider consulting with a financial advisor before making investment decisions. 🧡
In conclusion, TSMC’s impressive stock performance on December 23, 2024, is the result of a confluence of favorable geopolitical developments, strong financial metrics, and rising demand driven by AI innovation. As a global leader in semiconductor manufacturing, TSMC offers a unique investment opportunity for those seeking exposure to a rapidly evolving and highly lucrative industry.
Do you have a news tip for GuerillaStockTrading? Please email us at
[email protected]
🗨️ JOIN OUR COMMUNITY OF STOCK TRADERS AND INVESTORS ON SOCIAL MEDIA
💥 GET OUR LATEST CONTENT IN YOUR RSS FEED READER
We are entirely supported by readers like you. Thank you.🧡
At GuerillaStockTrading, we maintain full transparency and impartiality; we never blog about stocks or crypto in which we hold a personal position unless explicitly stated in the article. Additionally, we do not accept paid promotions presented as content. All information shared is for informational purposes only and should not be construed as financial, investment, tax, or legal advice, nor as a recommendation to buy any security or financial asset. The content is general in nature and does not account for individual circumstances. It may not be suitable for your particular situation. Before making financial decisions, you are encouraged to seek guidance from your own financial or investment advisor.