
TSMC’s Arizona Fab: A Game-Changer for U.S. Manufacturing and Big Tech 💯

Taiwan Semiconductor Manufacturing Company (TSMC), the world’s largest contract chipmaker, is making waves in the tech and investment worlds with the completion of a 3.5-million-square-foot fabrication facility in Phoenix, Arizona. As the most advanced chip fabrication plant in the U.S., this facility represents a pivotal moment for domestic chip production and its major customers, including Apple, Nvidia, and AMD.
TSMC’s New Arizona Facility
TSMC’s Arizona fab is currently in its pilot phase, producing sample semiconductor wafers for customer evaluation. This facility is part of a broader effort by TSMC to expand its footprint in the U.S., a move that aligns with increasing demand for secure and high-quality chip production closer to home.
Rick Cassidy, CEO of TSMC Arizona, highlighted the company’s commitment to staying on schedule and revealed plans to invest $65 billion to build two additional fabs on-site by 2030. These expansions aim to significantly enhance production capacity, supporting TSMC’s ambitious growth goals.
Apple: A Strategic Partner and Key Customer
Apple is poised to become the Arizona fab’s largest customer. CEO Tim Cook recently expressed excitement about sourcing American-made chips for Apple’s silicon products. Cook’s statement underscores Apple’s alignment with TSMC’s efforts to localize production and its broader vision of supporting advanced manufacturing in the U.S.
As Apple continues to lead the tech industry with its cutting-edge devices, its reliance on TSMC’s state-of-the-art chips reinforces the chipmaker’s pivotal role in driving innovation. For investors, the Apple-TSMC partnership highlights the strategic importance of both companies in shaping the future of technology.
Nvidia and AMD: Key Beneficiaries of TSMC’s Expansion
Nvidia and AMD, two of the tech sector’s most prominent players, also depend on TSMC for their advanced chip requirements. Nvidia, in particular, has seen explosive growth in its stock value, rising 171% in the past year, driven by surging demand for AI and graphics processing units (GPUs). AMD, a leader in CPUs and GPUs, similarly benefits from TSMC’s high-quality chip manufacturing.
By expanding its U.S. operations, TSMC not only strengthens its ties with existing customers but also positions itself to attract new business, meeting the growing demand for chips across industries such as artificial intelligence, gaming, and cloud computing.
TSMC’s Dominance in the Semiconductor Market
As the dominant player in the semiconductor industry, TSMC has established itself as the go-to supplier for big tech companies. Analysts like Daniel Newman of The Futurum Group emphasize TSMC’s unique ability to set prices for its high-quality chips, a testament to its reliability and innovation.
Over the past year, TSMC’s stock has surged by 96%, outperforming nearly all major tech stocks except Nvidia. This growth reflects investor confidence in TSMC’s ability to maintain its leadership in an increasingly competitive market.
Why TSMC Matters for Investors
For investors, TSMC represents a cornerstone of the global semiconductor supply chain. Its partnerships with tech giants like Apple, Nvidia, and AMD demonstrate its critical role in powering cutting-edge technologies. Additionally, its expansion into the U.S. mitigates geopolitical risks and aligns with the growing demand for domestically produced chips.
TSMC’s ability to innovate, expand, and meet the high standards of its customers makes it a compelling choice for investors seeking exposure to the semiconductor industry, which is at the heart of technological advancement.
TSM Stock Chart Analysis
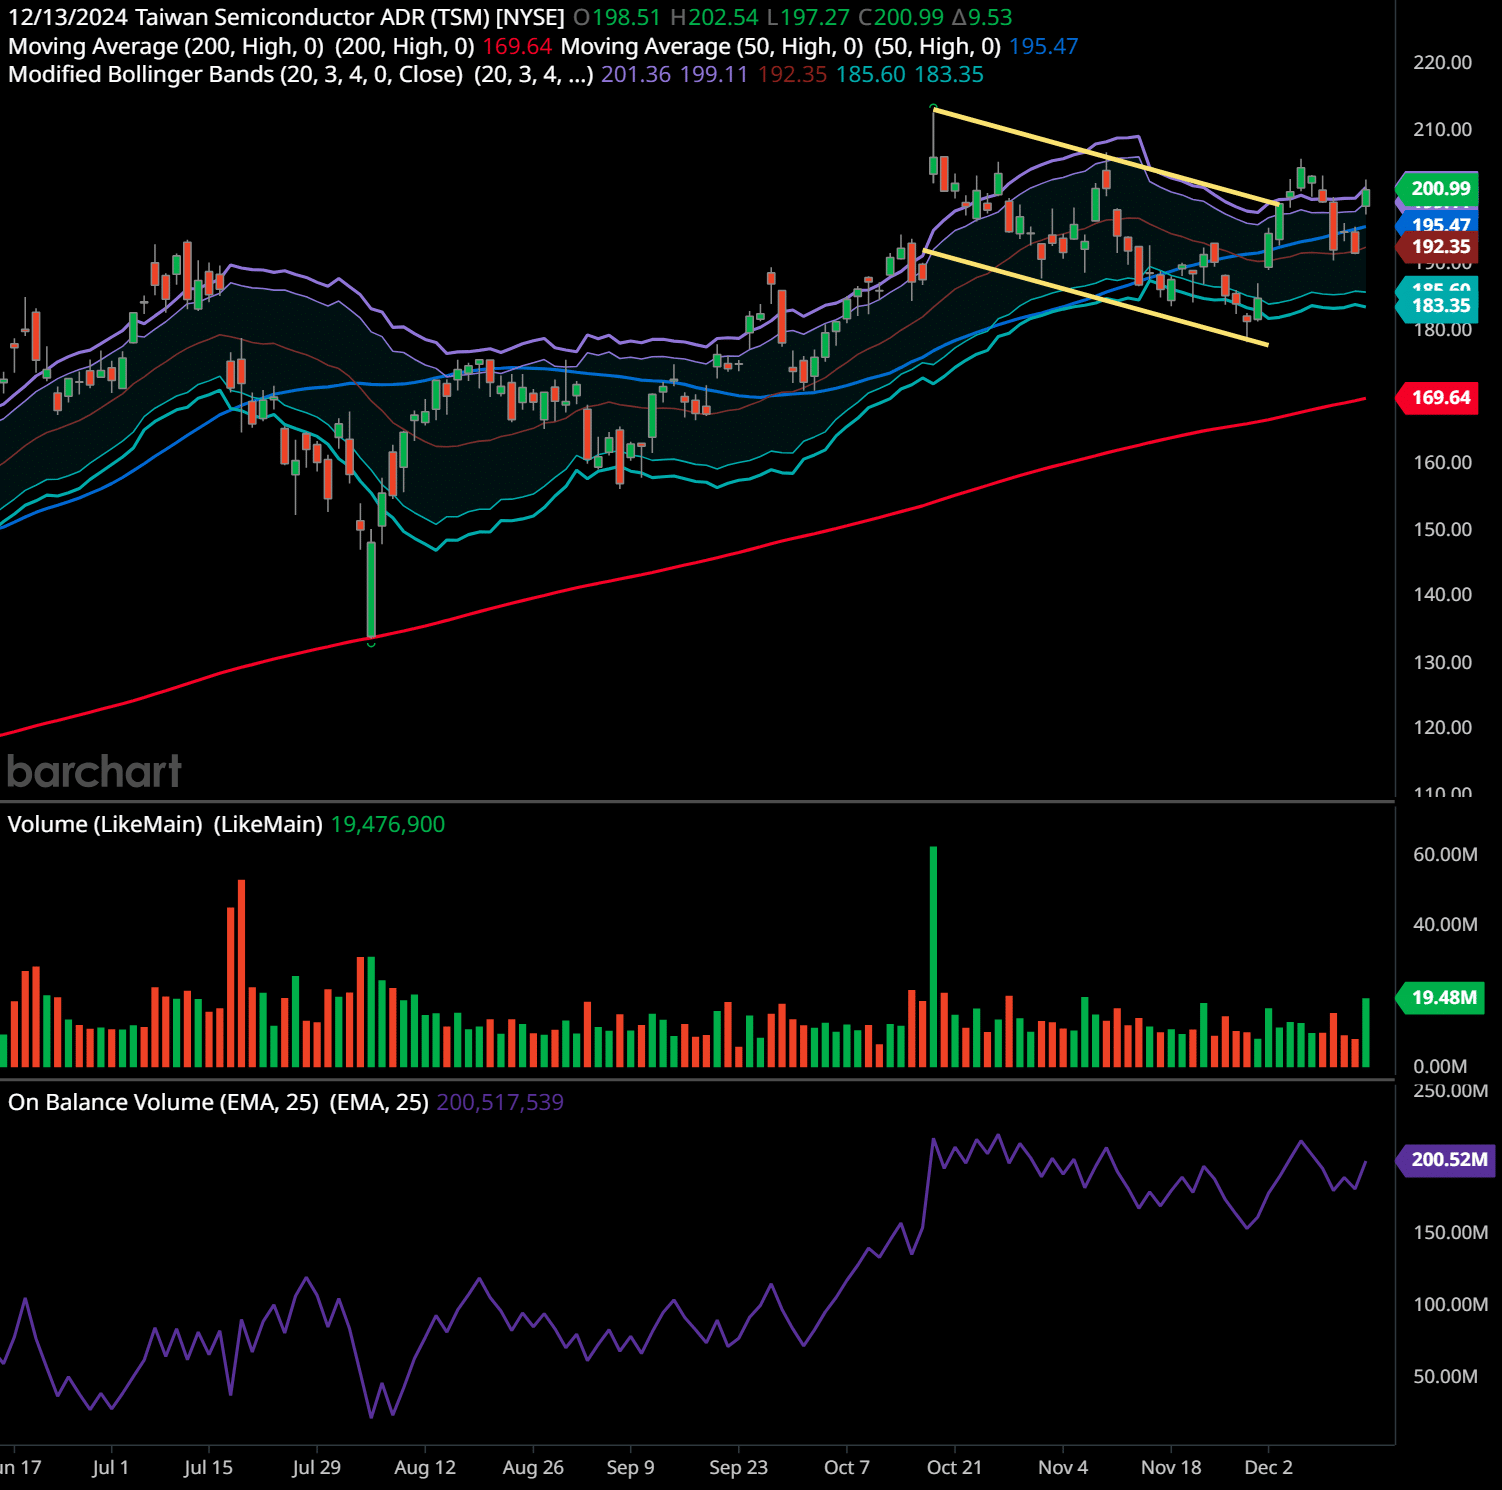
The provided chart for Taiwan Semiconductor ADR (TSM) presents a daily timeframe with the following indicators: 50-day and 200-day moving averagesThe concept of moving averages dates back to the early 20th century. While it is challenging to attribute the invention of moving averages to a single individual, W. P. Hamilton, a…, modified Bollinger BandsJohn Bollinger, a financial analyst and trader, invented Bollinger Bands in the early 1980s. He designed this technical analysis tool to measure market volatility and provide insig…, volume, and On-Balance VolumeThe On Balance Volume indicator (OBV) is a technical analysis tool used to measure the flow of money into and out of a security over a specified period of time. It is a cumulative … (OBVThe On Balance Volume indicator (OBV) is a technical analysis tool used to measure the flow of money into and out of a security over a specified period of time. It is a cumulative …). Here’s a detailed technical analysis:
Trend Analysis
The chart reflects an uptrend over the medium and long-term, with price consistently trading above the 200-day moving averageThe concept of moving averages dates back to the early 20th century. While it is challenging to attribute the invention of moving averages to a single individual, W. P. Hamilton, a… at approximately $169.64. This line represents long-term support. However, there was a period of consolidation and minor pullback around October-November, indicated by the declining highs and lows within the yellow descending channel pattern. Recently, the price broke out of this channel, suggesting a return to bullish momentum.
The 50-day moving averageThe concept of moving averages dates back to the early 20th century. While it is challenging to attribute the invention of moving averages to a single individual, W. P. Hamilton, a… (approximately $195.47) now acts as dynamic support, and price recently reclaimed it, further confirming strength. The stock is trading near the upper Bollinger BandsJohn Bollinger, a financial analyst and trader, invented Bollinger Bands in the early 1980s. He designed this technical analysis tool to measure market volatility and provide insig… ($200.99), which may indicate slight overbought conditions in the short term.
Key Support and Resistance Levels
- Support Levels: $192.35 (mid-Bollinger Band and recent consolidation), $183.35, and $169.64 (200-day MA).
- Resistance Levels: $201.36 (previous highs), $210 (psychological and historical high).
Indicators Interpretation
- Modified Bollinger BandsJohn Bollinger, a financial analyst and trader, invented Bollinger Bands in the early 1980s. He designed this technical analysis tool to measure market volatility and provide insig…: The price touching the upper Bollinger BandsJohn Bollinger, a financial analyst and trader, invented Bollinger Bands in the early 1980s. He designed this technical analysis tool to measure market volatility and provide insig… signals strong upward momentum, though caution is needed for a potential pullback or short-term consolidation.
- Volume: The recent breakout was accompanied by higher-than-average volume (19.48M), suggesting strong buying interest.
- On-Balance VolumeThe On Balance Volume indicator (OBV) is a technical analysis tool used to measure the flow of money into and out of a security over a specified period of time. It is a cumulative … (OBVThe On Balance Volume indicator (OBV) is a technical analysis tool used to measure the flow of money into and out of a security over a specified period of time. It is a cumulative …): OBVThe On Balance Volume indicator (OBV) is a technical analysis tool used to measure the flow of money into and out of a security over a specified period of time. It is a cumulative … shows a steady upward trend, indicating accumulation and confirming that buying volume outpaces selling volume. This is a bullish sign.
Chart Patterns
The chart shows:
- Descending Channel BreakoutBreakout patterns occur when a stock price moves beyond a defined level of support or resistance with increased volume, signaling the potential start of a new trend. A breakout ind…: This bullish breakoutBreakout patterns occur when a stock price moves beyond a defined level of support or resistance with increased volume, signaling the potential start of a new trend. A breakout ind… suggests a trend reversal, as the stock broke above the downward-sloping resistance line.
- Higher Lows Formation: After the breakoutBreakout patterns occur when a stock price moves beyond a defined level of support or resistance with increased volume, signaling the potential start of a new trend. A breakout ind…, higher lows around $183 and $192 reflect improving bullish sentiment.
Future Trends and Stock Price Forecast
The breakoutBreakout patterns occur when a stock price moves beyond a defined level of support or resistance with increased volume, signaling the potential start of a new trend. A breakout ind… above the descending channel, accompanied by rising volume and a strengthening OBVThe On Balance Volume indicator (OBV) is a technical analysis tool used to measure the flow of money into and out of a security over a specified period of time. It is a cumulative …, indicates potential for further upside. In the short term, the price could test resistance at $201–$210. A breakoutBreakout patterns occur when a stock price moves beyond a defined level of support or resistance with increased volume, signaling the potential start of a new trend. A breakout ind… above $210 would open the door for a longer-term rally.
However, the stock may experience minor pullbacks to $192–$195, which can act as strong supports for new buyers.
Trading Plans
- Swing Trading Plan (1–4 weeks):
- Entry: Around $195–$198 on minor pullbacks.
- Target: $201.36 (short-term resistance), then $210.
- Stop Loss: $192 (mid-Bollinger Band and dynamic support).
- Risk/Reward: Favorable 2:1 setup with risk capped below $192.
- Long-Term Trading Plan (3–12 months):
- Entry: Accumulate near $195–$200.
- Target: $220+ over the long term.
- Stop Loss: Below $183 to protect downside.
- Rationale: TSM remains in a broader uptrend, supported by strong fundamentals in the semiconductor industry.
Final Notes
The indicators, breakoutBreakout patterns occur when a stock price moves beyond a defined level of support or resistance with increased volume, signaling the potential start of a new trend. A breakout ind… pattern, and moving averagesThe concept of moving averages dates back to the early 20th century. While it is challenging to attribute the invention of moving averages to a single individual, W. P. Hamilton, a… all align for a bullish outlook in the short and long term. However, traders should watch for potential pullbacks or resistance near $201–$210 before initiating positions.
Past performance is not an indication of future results. This article should not be considered investment advice. Always conduct your own research and consult with a financial advisor before making any investment decisions. 🧡
Looking Ahead
TSMC’s new Arizona fab marks a transformative step in U.S. chip manufacturing, benefiting major customers like Apple, Nvidia, and AMD while boosting investor confidence. With plans for further expansion and a reputation for excellence, TSMC is set to remain a leader in the semiconductor market, driving innovation and delivering value to its stakeholders. For investors, the company’s growth trajectory and pivotal role in tech make it an essential player to watch.
Lance Jepsen is the senior personal finance writer for Guerilla Stock Trading who has spent more than 25 years covering the stock market and economics. In addition, Lance has worked as a private stock analyst for a number of high worth individuals.
Do you have a news tip for GuerillaStockTrading? Please email us at [email protected]
💥 GET OUR LATEST CONTENT IN YOUR RSS FEED READER
We are entirely supported by readers like you. Thank you.🧡
At GuerillaStockTrading, we maintain full transparency and impartiality; we never blog about stocks or crypto in which we hold a personal position unless explicitly stated in the article. Additionally, we do not accept paid promotions presented as content. All information shared is for informational purposes only and should not be construed as financial, investment, tax, or legal advice, nor as a recommendation to buy any security or financial asset. The content is general in nature and does not account for individual circumstances. It may not be suitable for your particular situation. Before making financial decisions, you are encouraged to seek guidance from your own financial or investment advisor.
Trading and Investment Ideas:
Source link


