Using Moving Averages On Daily And Hourly Charts To Time Credit Spread Entries

In the following two trade examples, we’ll use the 20-day and 50-day moving averages to identify a trend.
Then we’ll switch to a lower timeframe, such as the hourly chart, to fine-tune our entry points.
By timing our entries with precision, we can avoid unnecessary drawdowns and increase the probability of executing successful trades.
Contents
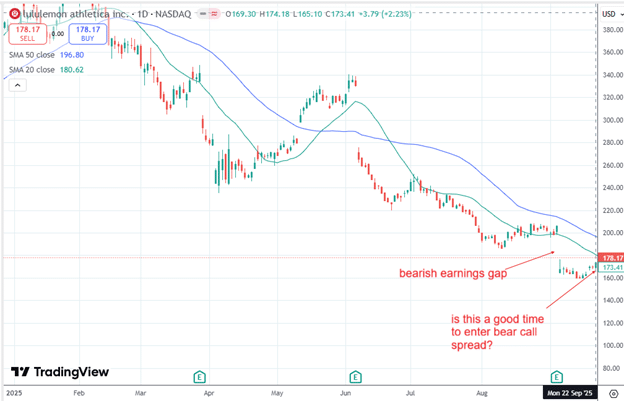
Lululemon (LULU) is in a bearish trend, as evidenced by the downward-sloping 20-day (green line) and 50-day (blue line) moving averages.
An additional bearish clue is the earnings gap on September 4th, 2025.
We want to initiate a bear call credit spread to profit from the stock’s downward movement.
But is September 22, 2025, a good time to enter the spread?
It is retracing to the 20-day moving average and approaching the gap’s resistance.
So some will say yes.
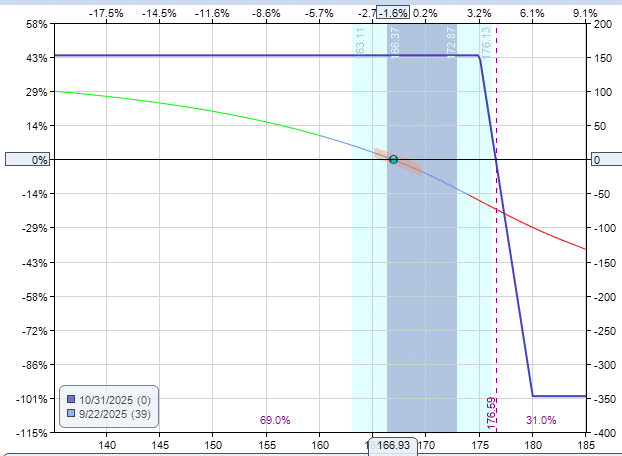
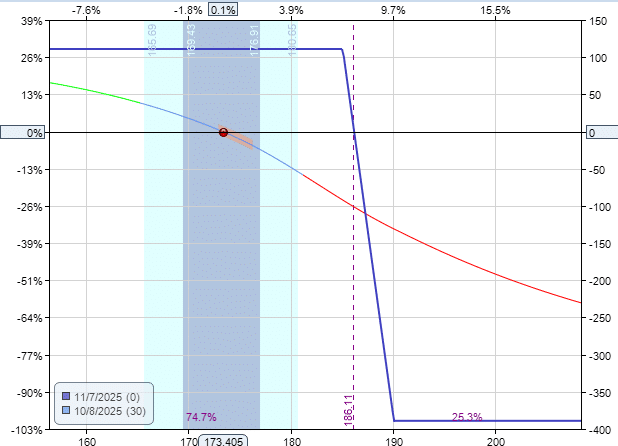
If one were to enter at that time with a bear call spread:
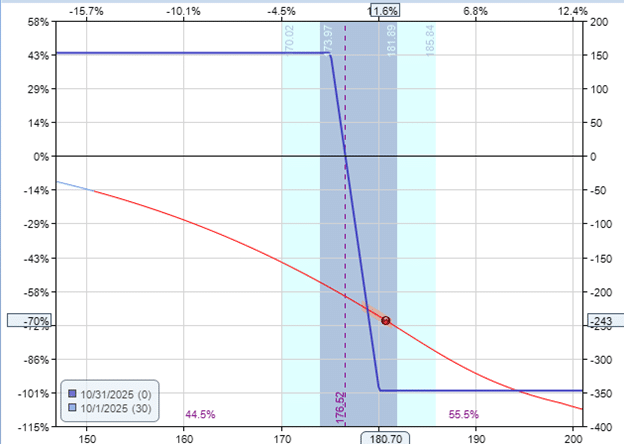
The P&L of the spread would be down -$243 (or 70% of its max risk) on October 1st…
Clearly, the stock didn’t go down as expected.
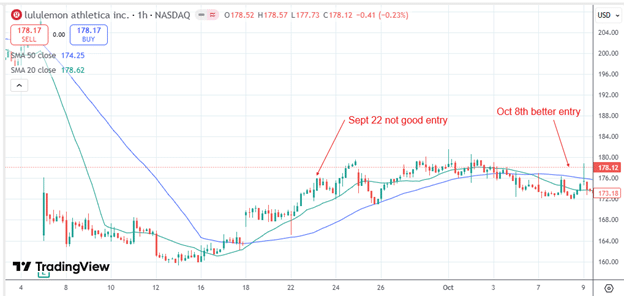
In hindsight, we can see that September 22nd was not an ideal entry because the hourly chart is still showing LULU is in an uptrend on the lower timeframe:
A better entry would have been on Oct 8th, when the 20-hour moving average (green line) and the 50-hour moving average (blue line) are downtrending, with the 20-period moving average crossing below the 50-period moving average.
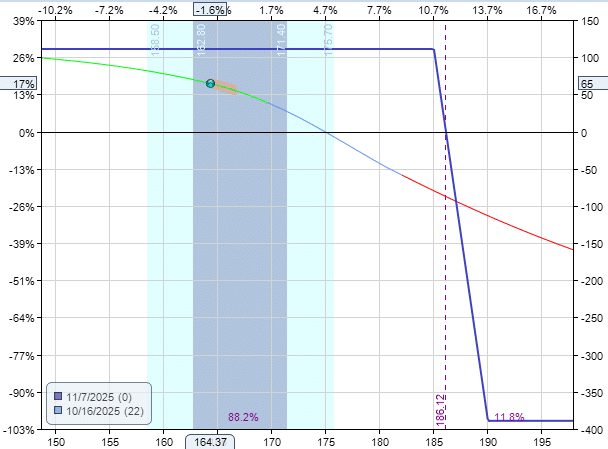
Here is a bear call spread entered on Oct 8th:
And eight days later, the spread has a P&L of $65 (or 17% return on risk) without any significant drawdown:
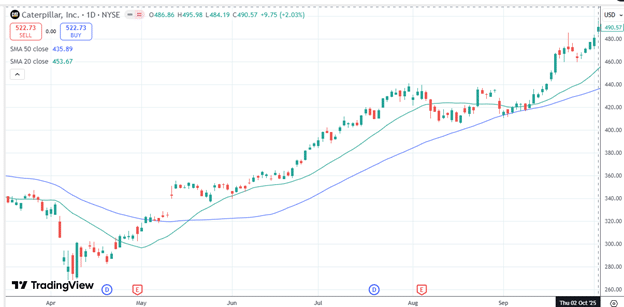
For the following example, let’s do a bullish example on Caterpillar (CAT).
The daily chart shows an uptrend on Oct 2nd, 2025:
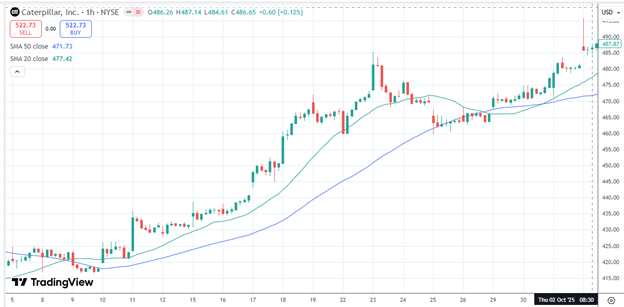
The hourly chart is also in agreement:
Now we have both timeframes with the 20- and 50-period moving averages sloping up.
It is pretty amazing how similar the daily and hourly charts look.
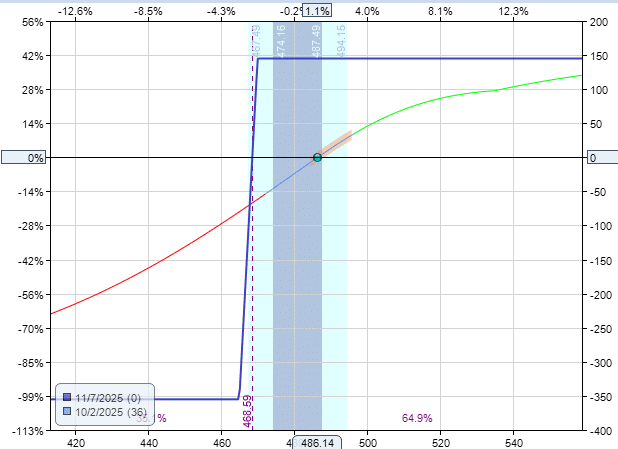
A bull put credit spread with 36 days to expiration is initiated on October 2nd:
Because this is a bull put spread designed to profit on a directional move rather than collecting theta from time decay, the spread is placed closer to the money (with the short strike at the 44 delta).
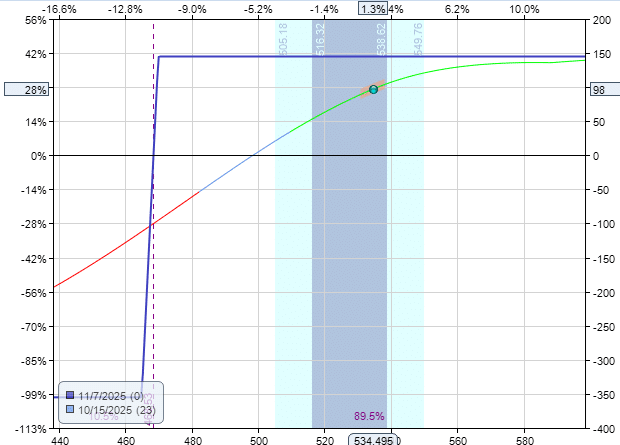
About two weeks later, on October 15th, the spread captured a profit of $98 (or 28% return on risk).
In these examples, we can clearly see how using multiple timeframes can significantly improve our ability to time entries into credit spreads, even when these positions are structured as longer-term trades with 30 days or more to expiration.
Aligning the broader trend on the daily chart with precise entry signals from lower timeframes reduces the likelihood of immediate drawdowns.
Having both the upper and lower timeframes in agreement allows us to enter positions with greater confidence.
We hope this introduction to multi-timeframe analysis has been helpful.
We hope you enjoyed this article on moving averages on daily and hourly charts to time credit spread entries.
If you have any questions, please send an email or leave a comment below.
Trade safe!
Disclaimer: The information above is for educational purposes only and should not be treated as investment advice. The strategy presented would not be suitable for investors who are not familiar with exchange traded options. Any readers interested in this strategy should do their own research and seek advice from a licensed financial adviser.

Source link