July 2025 DDD


I’ve been pounding the table on housing stocks and regional banks for weeks.
Why? Because when rates fall, the most rate-sensitive groups have toparticipate. And when they do, the gains come fast.
That’s exactly what I’ve been positioning for inside Breakout Multiplier.
Let’s rewind a bit…
Back in late June, I shared a thesis: homebuilders weren’t dead — they were coiling, setting up for a failed top and explosive move higher. I was watching the $XHB ETF closely and loading up on Zillow, Rocket Mortgage, and Wayfair like I was prepping to move (because I was).
I stepped in with calls on Rocket Companies $RKT. Then added exposure to D.R. Horton $DHI. And we rounded it out with a tactical trade on the Regional Banks ETF $KRE.
Fast forward to this week:
The DHI calls we bought for $2.70 just doubled. KRE calls we grabbed for $0.75? Also doubled. We took profits, sold half, and now we’re riding risk-free into the summer.
This is exactly what Breakout Multiplier is built for:
Find the coiled-up charts. Time the breakout. Push the edge. Lock in profits.
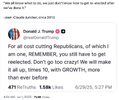
I doubled down on our bullish housing bets today as the entire space looks ready to rip. If you want that alert — and the next one after that — this is your moment.
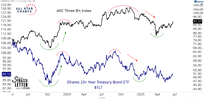
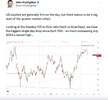
| You have probably heard me talk about the Three B’s before. It stands for banks, biotechs, and builders, and is a fun and convenient acronym I use when discussing the most interest rate-sensitive stocks. These groups could not be more different, but they share a key similarity in the sense that they all move in synchrony with the bond market. Biotechs are some of the longest-duration equities, so lower rates boost their valuations. It also allows these chronic cash-burners to access capital cheaply. Builders sell houses, and lower rates are the key demand driver, so that one is obvious. And banks are new to the lower rates list. We used to say banks want higher rates, or a higher spread—it’s how they make money. However, that changed recently as asset-liability matching issues arose from lending operations during the last rate-hiking cycle. Lower rates would relieve a lot of stress on the fixed-rate assets they hold and shore up balance sheets. The bottom line is that all these groups stand to benefit—and even take on renewed leadership roles— if rates were to come down. We’ve seen them outperform in the past when this was the case. And we’ve also seen it in the opposite direction… which has been the case since last year’s highs. Here is a chart showing an equal-weight index of the ThreeB’s compared with treasury bonds: |
| |
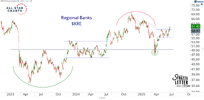
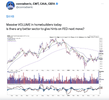
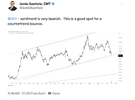
| It’s not perfect, but all three of these industry groups tend to ride the waves with the bond market. Notice how the bull market for these interest rate-sensitive stocks ended abruptly last year right around the same time bonds began collapsing. Bonds peaked in September and promptly rolled over. The 10-year yield ripped from 3.60% to 4.80% over the course of the next 4 months. During this period, homebuilders, banks, and biotechs each experienced drawdowns of more than 30%. But I think that’s over now, and I think it has everything to do with the idea that rates have peaked for this cycle. And don’t shoot the messenger, because I’m not the one saying it—the market is. All these interest rate-sensitive areas are heating up. Builders had one of their best sessions of the past few years today. Biotechs are the only thing working in health care. And I think you throw the impressive performance from speculative growth into this conversation. That price action is the kind of thing you see when liquidity is improving and rates are coming down. And lastly, the banks put up a major move today, confirming this theme as well. Here’s the Regional Bank Index $KRE reclaiming its VWAP from the post-election breakaway gap on November 6th. |
| |
| It’s ironic because that’s around the last time I felt this good about the banks. I think they and the other B’s are poised for new leadership into the back half of the year. I think these are the groups you want to overweight if you believe rates are headed lower. And we’ve already been doing it via Breakout Multiplier. Last week, we put new trades on banks and builders, and today we sold the double in both of them. |
Copper;
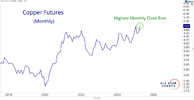
| Copper just made history. The price closed June with its highest monthly close ever. Copper futures are printing fresh all-time highs after resolving a prolonged accumulation pattern. And when copper moves, it isn’t just about metals—it’s about yields, growth, and what comes next. |
| |
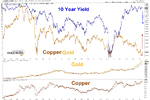
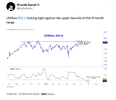
| Next up is a chart of the Copper/Gold ratio versus the 10-year yield. Forget the recent noise, for decades, long-term yields have followed the Copper/Gold ratio. When Dr. Copper outperforms, yields rise. Every time. Why? Because copper is associated with construction, production, and demand. It’s the heartbeat of the real global economy. Gold is fear. Copper is action. When Copper leads, the market’s not bracing for collapse. Instead, it’s pricing in growth. This is one of the biggest divergences we’ve ever seen: |
| |
| In recent years, the Copper/Gold ratio and the 10Y yield have carved out one of the largest divergences in history. And now we’re seeing early signals that the ratio is going to reverse higher. What happens if it breaks higher from here? Yields are going with it. Not because of rate hikes. Because of real demand. Now ask yourself: What happens if the Fed cuts rates while copper is breaking out and China is ramping back up? We’ll get a firestorm in commodities. You think 2020–2021 was hot? That was driven by stimulus and broken supply chains. This bull market is being driven by demand picking up globally and a falling dollar stoking the fire. Hemingway once said, “How did you go bankrupt? Two ways. Gradually, then suddenly.” That’s how breakouts happen, too. And copper just went suddenly. |
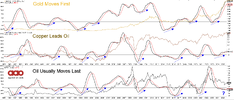
| It’s not a theory—it’s the cycle. It’s happened again and again for over 50 years. You don’t need to believe in narratives when the pattern is this consistent. Gold already broke out. Copper just posted the highest monthly close in history. And oil? Still chopping. Still forgotten. But this is how it works—oil always moves last. Take a look at the chart. Oil is next in line. |
| |
| That’s what I’m watching for. The structure in energy is starting to tighten. The trend isn’t fully there yet, but the setup is forming—quietly. This is how inflection points begin: slowly, then all at once. You don’t need to time it perfectly. Everyone remembers 2020–2021. That was stimulus into broken supply chains. This time, it’s different. This is real demand picking up globally, with a falling dollar, a reaccelerating China, and a Fed that’s preparing to cut. That’s not bearish for energy. That’s rocket fuel. While most are still chasing tech and debating soft landings, I’m watching the real trade take shape—beneath the surface—where the cycle is whispering what’s next. “Take time to deliberate, but when the time for action comes, stop thinking and go in.” — Napoleon Bonaparte Gold moved. And this time, I plan to be ready. |
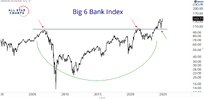
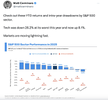
| We continue to see major indexes and key sectors pressing to fresh all-time highs. This year, it’s all been about sector rotation — the steady flow of money into fresh leadership that keeps the trend moving. And right now, Financials are stepping up in a big way. When we talk about areas poised to benefit from this rotation, banks are at thetop of the list. Our custom, equally weighted index of the six biggest US banks is now joining the growing list of indexes breaking out to new all-time highs. |
| |
| If we’re going to get a sustained breakout in Financials at the sector level, the big boys need to show up. And following that line of reasoning, if the biggest banks are in good shape, then the broader market probably is too— meaning the bull market has room to run. |
|
Full:https://www.wsj.com/tech/amazon-war…f?st=WkWaET&reflink=desktopwebshare_permalink
AI
Productivity, AI and pushback
Typesetters did not like the laser printer. Wedding photographers still hate the iphone. And some musicians are outraged that AI is now making mediocre pop music. One group of esteemed authors is d…
seths.blog
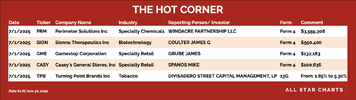
| Perimeter Solutions $PRM – Windacre Partnership filed a Form 4 for $3.56 million. They’re known for concentrated bets, and this is a solid size for a specialty chemicals stock completing a multi-year base. When Windacre shows up, it’s rarely passive.
Not giant, but Gamestop is never boring. Insider buying at these levels is notable, especially as the meme-fueled volatility calms down. Here’s The Hot Corner, with data from July 1, 2025: |
| |
| Click the table to enlarge it. |
| Casey’s General Stores $CASY – Director Mike Spanos picked up $101,000 in stock. Steady, boring retail name that just keeps compounding. Always nice to see the board putting skin in the game.
This transaction caught our attention as TPB continues to coil near its all-time high. |
Tariffs;
Trump’s tariffs add about $82 billion in total new costs for all mid-sized U.S. companies, per a new estimate — a sum that would more than double if rates return to levels seen at the height of trade tensions in April.
Why it matters: That finding, from the JPMorganChase Institute, is among the first to tally the hit to select businesses that are more likely to rely on international trade.
- It gives some insight into the magnitude of costs that could ripple out to the rest of the economy — either in the form of price hikes or slimmer margins that could force owners to shrink costs elsewhere, perhaps via layoffs.
- The figure estimates costs under the current trade regime, which includes last month’s U.S.-China negotiations.
- “As we approach the end of the pause on many steep tariff hikes that were announced on April 2nd, it has become increasingly urgent to understand which firms are the most exposed to potential costs,” a companion report out today says.
- The sector disproportionately relies on imports from countries with the highest Trump-imposed tariff rates, including China and other Asian nations.
- “They may be bigger than the very smallest businesses, but they’re not the largest — and tariffs are of a magnitude that are not easily absorbed,” Wheat says.
- Top Trump officials say that a flurry of trade deals will be announced in the days leading up to July 9, when the pause on those “Liberation Day” tariffs expires.
- The universal tariffs announced then, including triple-digit levies on Chinese goods, added $188 billion in direct import costs to midsize firms — more than 6 times the costs imposed by the earlier tariffs in place at the start of 2025.
- Put another way, that is 7% of total payroll, on average.
The U.S. labor market has been steadily cooling. ADP says that slow deceleration abruptly halted last month.
|
And I still haven’t had time to get to the monthly charts, but JC has;
- I’m reviewing 200 charts to start July.
- I’ll look at all asset classes, and I’ll look around the world.
- This is how we identify trends.
It’s perfectly natural.
We’re efficient animals who can multitask without even realizing it.
How many times have you driven your car home while thinking about a million other things.
And you safely arrive in your driveway, not even remembering most of the ride.
The mind is powerful like that.
Market Hacks
Over many years in the market, as a trader and an investor, I’ve learned the hard way that you can’t cheat the system.
It doesn’t work that way.
I have made one discovery.
And it begins with what we know to be true about the behavior of asset prices.
Asset prices trend.
They’ve done the math, and we know it for a fact.
You can read the white papers, and you can talk to the academics. You can even use common sense: Go see for yourself.
If the price of a stock is trending higher, there is a much higher likelihood the price of that stock will continue higher vs reversing and heading lower.
This is the truth.
This is why Technical Analysis works.
And if we know asset prices trend…and if we know we only get paid if we sell at higher prices than we buy…
We should probably spend time looking for those trends.
And so that’s what we do.
| ** Special Announcement from JC ** JC is finally revealing the top project he’s been cooking up here at TrendLabs. It’s the culmination of all JC’s work over a 22-year career… According to a beta-test, it generated a 100% gain on the first half of the position in less than TWO days. And since then, gains on the first half of positions of 116%…121%… 123%… and a gain of a 117% on the first half of a recommendation, all within around 30 days… Go here now to watch JC’s special announcement for Everybody’s Wrong. |
Multiple Timeframes
Whenever we’re looking for trends, the rule of thumb is to always go one timeframe higher than where you normally trade or invest.
In other words, if you tactically use daily charts going back six to nine months, take it one degree higher.
Look for trends on the weekly charts going back several years to get structural perspective.
If you’re a day-trader or swing-trader who uses 10-minute charts for tactical decisions in the market, look at daily charts for the longer-term time horizon.
This is the multiple timeframe approach.
My friend Brian Shannon wrote a book about this concept, “Technical Analysis Using Multiple Timeframes.”
Monthly Charts
Regardless of time horizon, my cheat code for trend identification is to analyze the monthly charts.
No one does this.
And they’re all wrong.
This is THE hack in the market.
We only get monthly candlesticks 12 times per year. That’s it. There aren’t that many.
Because of this, not only does this process help us identify the direction of primary trends, it gives us no choice.
It’s so easy to get lost in the day-to-day noise.
“What did the Dow do today?
“What did Powell say?”
“What did Trump tweet?”
To ignore it all, to be able to see past it, every day, in real time, is difficult.
That’s where the monthly charts come in.
With only 12 data points each year, this process of reviewing monthly charts forces us to recognize the direction or primary trends.
We don’t want to fight these trends. That’s a great way to lose money in the market.
We know for a fact, mathematically, that we want to be on the right side of these trends.
That’s how we are able to make money consistently over time.
All the Assets
So which monthly charts do we want to review at the beginning of every month?
All of them.
That includes the major U.S. indexes – the S&P 500, the Dow Jones Industrial Average, even the small-caps and mid-caps.
We look at indexes for countries around the world, including Germany and the rest of Europe, China and all of Asia, and Brazil and Latin America.
And we check ETFs that give investors exposure to these markets.
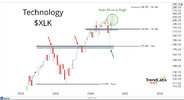
We also do a Sector-by-Sector scan: Energy, Financials, Technology…
We also look at Biotechnology, Regional Banks, and Semiconductors too. These are the Industry groups, and they’re also included in this process.
We do the intermarket analysis on longer-term monthly charts, such as Commodities, including Crude Oil, Gold, and Silver.
Our process also covers Currency markets and Interest Rates as well.
I have a list of about 150 to 200 monthly charts I review at the beginning of every month, with fresh monthly closing data.
It’s the most valuable part of my entire process.
This is the cheat code.
This is the life hack.
Nobody else does it.
And everybody’s wrong.
You know I’ll be here doing it every month. It’s the best way to make sure that you’re on the right side of trends.
Because we know asset prices trend, we need to find the best way to identify these trends.
And this is it.
- Never has the index of the most important exchange on Earth been this high.
- “American Exceptionalism?” It’s just the way the world works.
- We’re headed even higher from here.
I’ll save that story for another day.
But I will say this: The coolest part about the Tokyo Stock Exchange is not the exchange itself.
It’s that it’s in Japan.
And the food there is amazing.
There’s a 7-11 next to the Philippines Stock Exchange in Manila that includes a secret passage to a speakeasy.
Outside the Bombay Stock Exchange in Mumbai, they actually have a giant bronze bull, just like the one on Broadway in New York City.
There are plenty of stock exchanges around the world with plenty of secrets and surprises. That I can tell you from experience.
But there is nothing like the New York Stock Exchange.
And it’s not even close.
I don’t just mean in terms of architecture, history or what it represents.
I’m talking specifically about the stocks that trade on the exchange.
The most important stocks on the planet trade on the NYSE.
In fact, a large percentage of the biggest 100 listed companies aren’t even American.
You’re getting a lot more exposure to international stocks, small-caps, and mid-caps.
And there are more economically sensitive areas like Financials and Industrials represented that you won’t get on other exchanges, such as the Nasdaq.
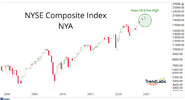
If you take all the stocks on the NYSE and create a composite index, this is what you get:
And the NYSE Composite Index just put in its highest-ever monthly and quarterly closes.
Never has the index comprising all the stocks listed on the most important exchange in the world been this high… ever.
One thing we know for a fact is asset prices trend.
And when indexes are making new highs, there’s a much much higher likelihood we see more new highs… and then even more after that.
Who’s No. 2?
We can go back and forth about whether the Dow Jones Industrial Average or the S&P 500 – or something else – is the most important stock market index.
That’s a valid debate, for sure.
But the most important exchange? No one disagrees.
The NYSE is it.
So, fine.
Who’s No. 2, then?
After much debate and deliberation, I think it’s probably the exchange just uptown from the NYSE.
It’s the one buried in the middle of Times Square.
Sorry Frankfort Stock Exchange, it’s the Nasdaq.
Let’s be real: The U.S. is just that dominant when it comes to capital markets.
The NYSE is No. 1.
And No. 2 is the Nasdaq, just up the road.
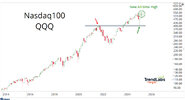
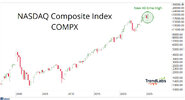
Here’s the index of all the stock listed on that exchange:
The Nasdaq Composite just hit new all-time highs on a monthly and quarterly basis too.
The Nasdaq is different from the NYSE in meaningful ways.
You’re not going to get all those Banks and Energy companies up at the Nasdaq.
More than 60% of the Nasdaq’s total weighting is Technology stocks.
Another 18% is Consumer Discretionary – think Amazon.com (AMZN).
You’re not getting any Materials, almost no Energy, no Real Estate, no Consumer Staples, and little to no Industrials or Financials.
To be sure, the Nasdaq is NOT “the stock market.”
The Nasdaq is the Nasdaq.
It’s it’s own thing.
And, in my book, after the NYSE, the second-most important exchange is the Nasdaq.
I’d like to chalk this one up to American Exceptionalism.
But the truth is, a ton of foreign stocks trade on the NYSE, especially among the big ones.
So it’s not an “American” thing.
It’s just the way the world works.
Everybody’s Wrong
Almost no one I know looks at the NYSE Composite Index.
They’re focused so much on the S&P 500 and the Nasdaq100 and even the Russell 2000.
And they forget about the stocks on the world’s most important exchange.
I was told by a millennial trader recently that it’s funny how I look at “exotic indexes” such as the Nasdaq Composite.
This guy literally called the index made up of the stocks that trade on the second-most important exchange in the world “exotic.”
Meanwhile, the Nasdaq Composite dates to February 1971, decades before he was even born.
It’s got the Street cred.
It’s earned my respect.
But I’m still telling you: Everybody’s wrong.
Keep a close eye on these two indexes, not just in this environment, always.
But look at the NYSE Composite first.
Stay sharp,
jog on
duc
Source link