Mainly Miners
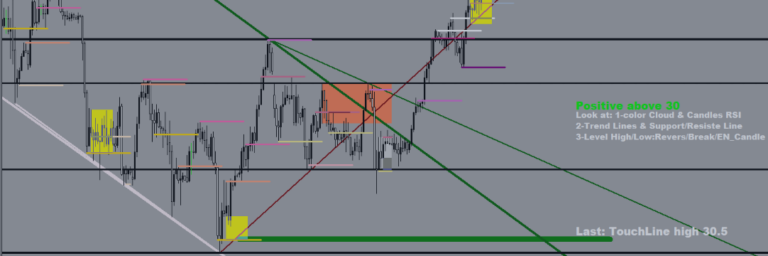
WGX daily chart showing lower lows and lower highs, could indicate a trend change which may send it lower, but it also looks very much like a bull-flag which could see it go back to 2.50 and potentially break through the resistance there. The positive seasonality of gold for Jan/Feb would favour it going higher. I wouldn’t buy at the current price based on the price action unless it breaks through the upper trend resistance line with strong volume.
What do you think is more likely: bull…