
VantagePoint Vantagepoint A.I. Hot Stocks Outlook for October 31, 2025 Stocks $PSA, $QGEN, $CIEN, $LCID, $GS, $WRBY
Register for a Free Live Training
The Hot Stocks Outlook uses VantagePoint’s market forecasts that are up to 87.4% accurate, demonstrating how traders can improve their timing and direction. In this week’s video, VantagePoint Software reviews forecasts for Regeneron ($REGN), Arrowhead Pharmaceuticals ($ARWR), Ciena ($CIEN), Roblox ($RBLX), Warby Parker ($WRBY), Automatic Data Processing ($ADP)
Hello again, traders, and welcome back to the hot stocks outlook for October 31st, 2025. Uh, as always, hope you’re having an excellent week out in the financial markets. And as always, we’re here to take a look at the most recent Vantage Point AI predictive forecast.
So, if you haven’t already, be sure to go ahead and click on that link down in the description below, and you can get signed up for a live demonstration and learn how all these predictive technologies are helping traders make much better trading decisions, uh, when out in the marketplace.
And so, uh, this is a really interesting week. We have a lot of earnings reports, uh, and a good opportunity to review many of these opportunities we’ve looked at on previous hot stocks outlook videos and really update this because it’s really about moving forward through time, having this adaptive technology help guide the trading decision-making process.
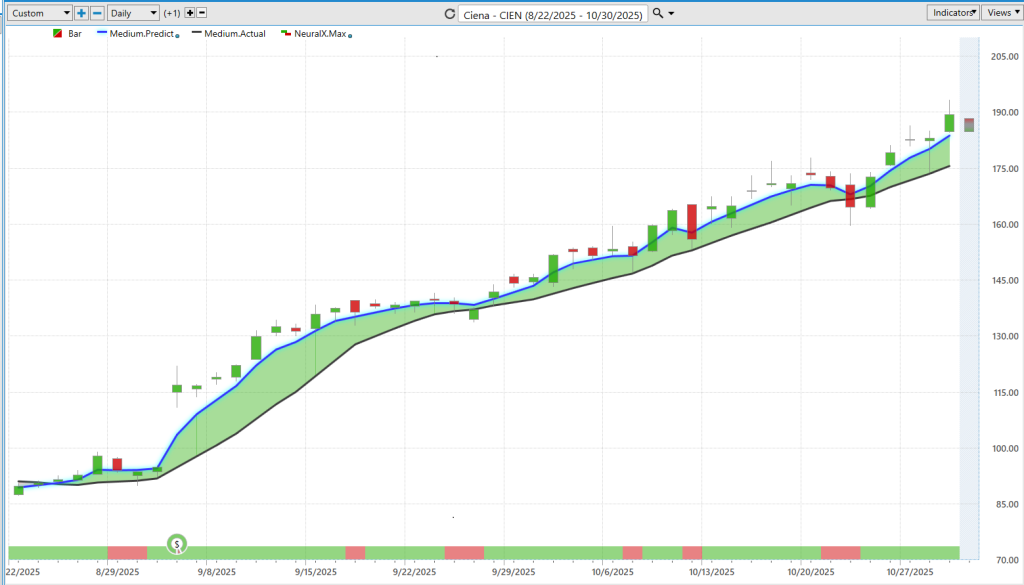
And so, uh, here we have Ciena Corporation. It has been a stock that’s performed very well, really with this, uh, data center buildout that’s going on, and one of the few markets that has remained in an uptrend. There’s been a lot of sort of talk around the S&P grinding higher while the majority of stocks are actually in a downtrend.
Uh, this is a stock we keep coming back to and say, “Okay, well, how do all of these predictive indicators work together?” Well, what we’re looking at here is daily bars and candles. So each one of these candlesticks, well, that’ll represent a full and complete trading day.
Uh, and so it’s right up against all those daily bars and candles that you’ll notice that there is a black line and also a blue line value. And so what the black line value is, is actually just a simple moving average. So it’s a very common technical analysis indicator. And in all these examples every week, it’s always a 10-period.
So, it looks at the previous 10 closes, adds them all together, and then divides by 10. And so one of the weaknesses with traditional technical analysis is that all that data is coming from the past. And it’s really just telling us about this one market in isolation as far as where Ciena prices have closed.
And so Vantage Point traders can use that as a baseline, right? Letting us know where those market prices have been. But what we can do is compare that to this proprietary predicted moving average. And for this value, which is really a price that’s getting plotted on the chart every evening for that value to get calculated, well, this is where the technology of artificial neural networks comes into play, and they’re performing what we would call intermarket analysis.
And so what that means is that rather than just rearranging past prices, uh, Vantage Point is looking at other markets that are known to drive and influence future price. So this can be things like the broader indices like the S&P 500. It can be ETF groups, it can be other individual stocks, and it can even be things like global currencies or global interest rates.
And so, specifically to this market, it’s going to understand how all the data from these other markets helps to really give us price clues as to where things are headed next. And we build that into these predictive indicators.
So, whenever we see this blue line cross above the black line, well, it’s suggesting that those average prices are going to start moving higher, and traders may want to look to take long positions. And we see over the past 46 trading days now, Ciena Corporation is up about 106%. So even 50 shares there is about a $4,800 move.
Uh, and so what’s really interesting about this is regardless of your trading strategy, whether you’re shorter-term or longer-term swing trading, you can really use the indicators to build out that expectation of what’s likely to occur.
And so even if we just look at this past week and say, “Okay, well, Ciena Corporation, it’s in an uptrend. It’s in a nice sector and an area of focus in the market.” Well, this is where these shorter-term predictive indicators come into play.
So if we look at the bottom of the chart here, you’ll see this bar that goes from green to red and back to green. Uh, and this is what’s called the Vantage Point predicted neural index, and it’s tuned to solve a different problem than our predicted moving average.
What it’s doing is looking at short-term strength or weakness over the next 48 hours, or what you can think of as a couple of candlesticks, uh, and can help traders be ahead of short-term weakness in the market and really kind of combine this overall forecast.
And so you see here, as the neural index gets bearish, we get a dip the next trading day, prices moving lower, but the overall trend still remains bullish. And so this is where traders can then rely on intraday predictions via the Vantage Point predicted highs and predicted lows.
Now getting into intraday price levels that traders can use, uh, to really execute their game plan. And what we can do is see how accurate all of these predictions are. So you see, as the predicted trading range starts to slant a little bit lower, we get that high volatility day.
And even just this past week, this would have been Tuesday, signaling that here’s a really nice opportunity to accumulate shares of Ciena. Uh, and we’re only up about, you know, 5% or so and shares going higher even today into Friday. So, uh, really interesting opportunity here—about 7% just this past week—again identifying one of those markets that is in a strong uptrend.
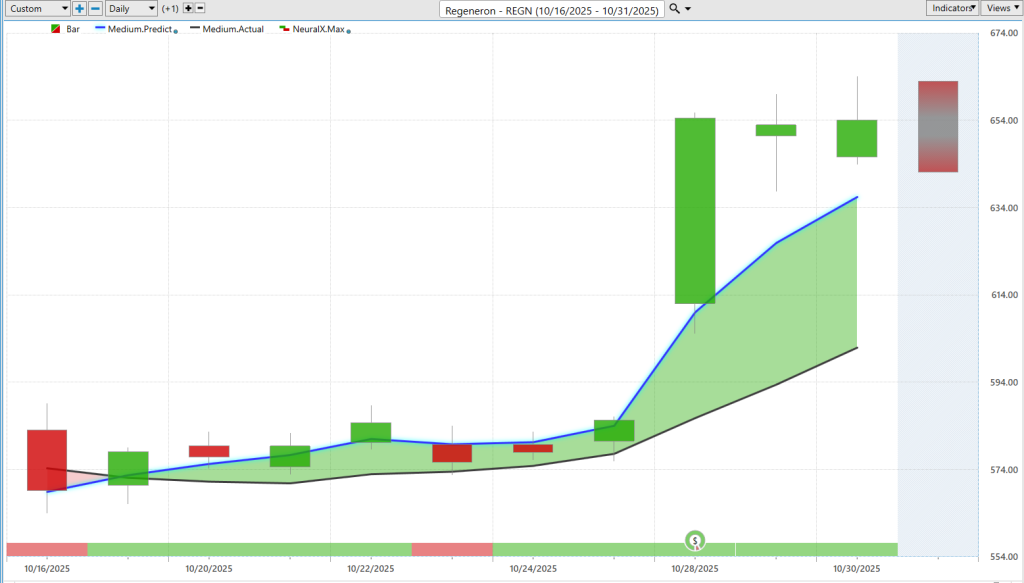
Uh, now, we’ve seen a lot of earnings reports this week, and so that can lead to a lot of volatility in the market. And well, here’s Regeneron.
So here’s an example of, you know, really a couple of weeks ago, we start to see that blue line cross above the black line, letting us know we’re in an uptrend. So see, your neural index gets bearish here; you get a couple of days right before that earnings report, uh, but still a lot of separation in that market, remaining in an uptrend.
And as we look back at these predicted highs and lows, we really see how this works—especially when the market is sort of indecisive going into earnings—understanding where those valuable levels are to accumulate a position. Even see on this trade day bouncing off the predicted high, going a little bit lower, and then having that huge move out of earnings.
Then even after earnings, doing a good job of saying, “Okay, well, where is this market likely to trade?” Recognizing what’s occurred here and how things have shifted over the past couple of trading days. So, this is what’s great about these tools—they’re really responding to volatility as well and can provide a very quick analysis so that traders can make informed decisions about how to position themselves in the market.
So, we see about a 12%, almost 13%, rally here just in the past nine trading days.
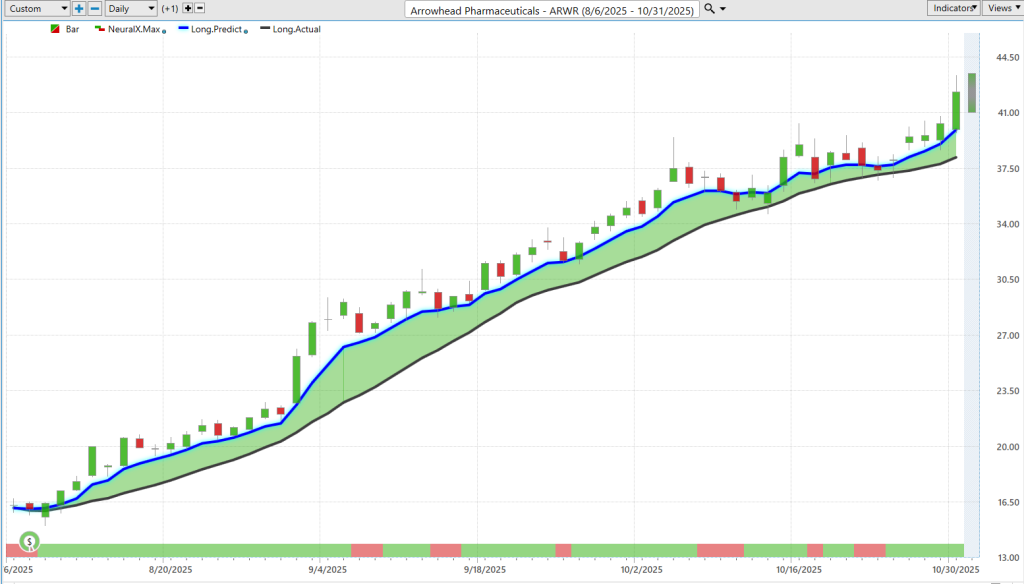
Arrowhead Pharmaceuticals ($ARWR)
As we move forward, here’s Arrowhead Pharmaceuticals. So, this has been another stock we looked at several weeks ago. Uh, blue line going over the black line all the way back here.
So again, recognizing these markets that are in strong uptrends. Uh, what’s interesting about this is we actually dip below as far as the predicted moving average, but look down at your neural index. Actually, it just remained bullish through that entire period, uh, indicating that, look, there’s actually strength here over the next couple of days.
And as we understand, okay, this is a market that’s in a strong predicted uptrend, uh, we can use those Vantage Point levels. So, understanding that, hey, look down towards these predicted lows. We sort of scoot down that trading day—predicted low here, predicted low this last week coming in on Wednesday—and then seeing shares just continue to move higher in these markets that are in clear uptrends.
So even here, just over the past couple of trading days, another 9% rally here, uh, in just the past two trading days. Really, since this market started getting moving, up about 165% here. Uh, again, about 500 shares, about a $13,000 move, uh, in what would have been a pretty cheaply priced stock going back to August when this started to move higher.
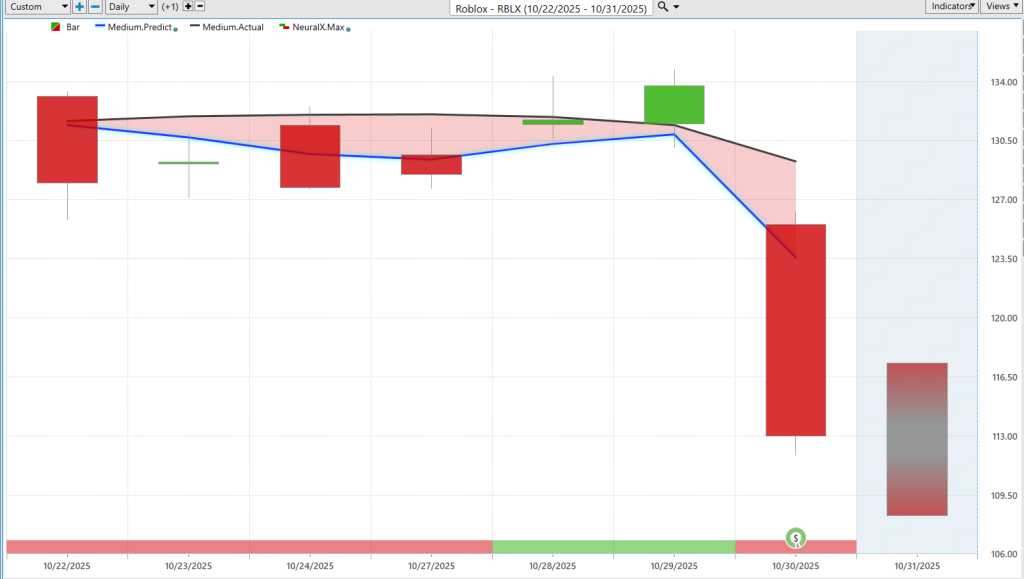
Now here’s shares of Roblox. Another sort of like Regeneron, right? Like going into earnings. Uh, here we see this blue line now crossing below the black line.
Lot of weakness here. Neural index saying, “Okay, we might get strength over that next trading day,” but then the earnings report coming through and things really getting driven lower.
Uh, and even this last trading day on Friday here, we’ve scooted up to this predicted high and seeing this weakness sort of continue to play out. So, uh, we’ll see how this continues to play out over the next few weeks, uh, but just clearly identifying, “Okay, well, what markets look more, you know, like structured bullishly if you want to trade around those earnings reports? Where are we seeing that weakness?”
See about a 12–13% decline just in the past six trading days.
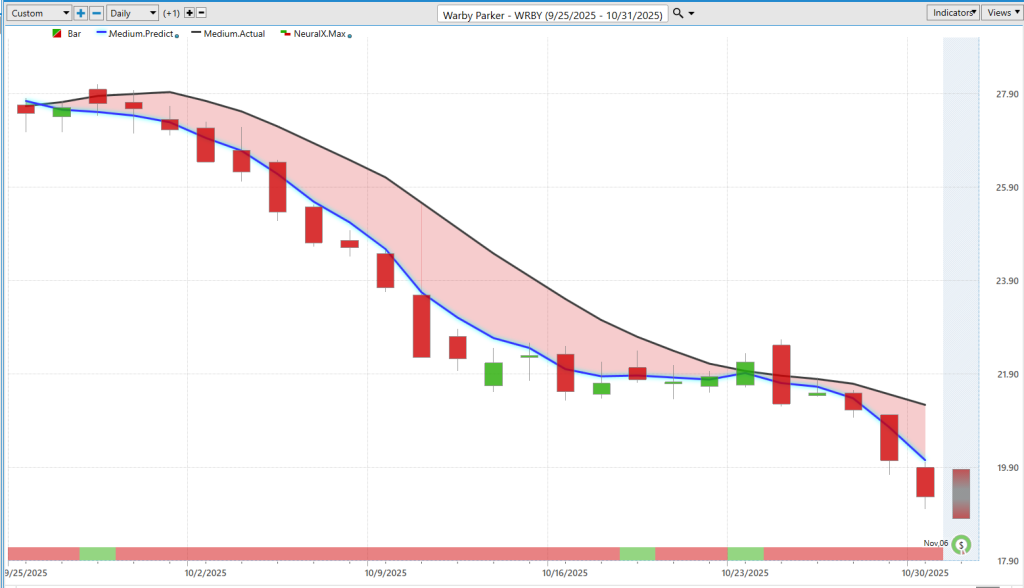
Uh, Warby Parker is another name we looked at a couple of weeks ago—very clearly here in a very, very strong downtrend.
And so, you see as we even get a little bit of strength from the neural index—a little consolidation in the market—clearly the trend is still bearish. So if you want to, uh, set hedges in the market to really, you know, kind of contrast some of your long positions—clearly here, you know, want to be shorting up at these predicted highs and again just updating the forecast every day.
And that’s where Vantage Point is very effective—really adapting to those changing market conditions, uh, really shifting those probabilities based on those intermarket relationships, and, uh, making sure you really position yourself on the right side of some of these moves.
About a 30% decline now, uh, in just 24 trading days. So clearly an area where we’re seeing, uh, very intense weakness. And it sort of falls into that big narrative of the market where there’s more stocks that are actually weak and few stocks really responding to that, you know, uh, data center AI buildout doing well. But outside of that, you want to be pretty careful here.
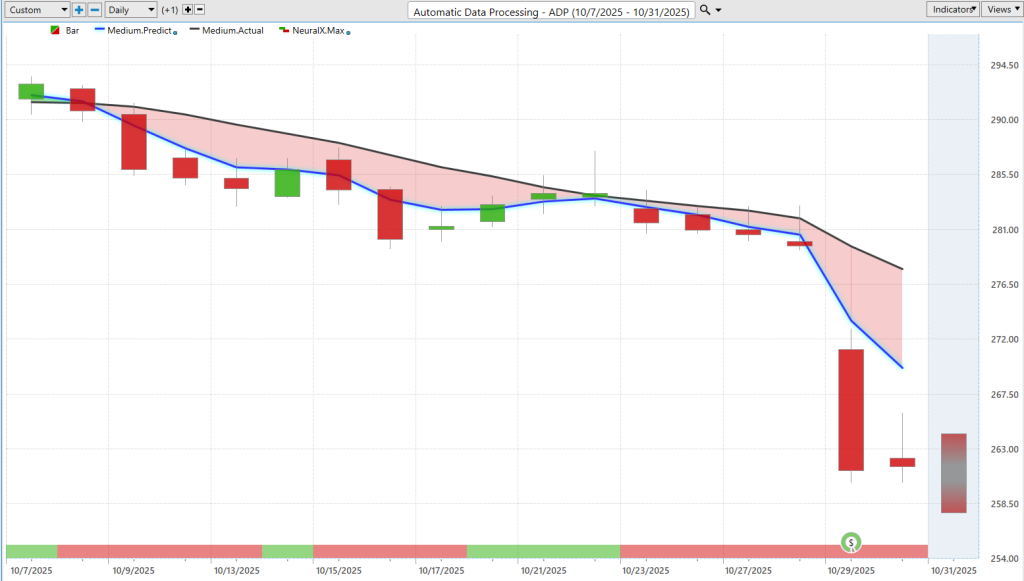
Automatic Data Processing ($ADP)
Uh, here’s ADP. So again, very large stock, large company here. Blue line crossing below the black line, neural index getting bullish, and you get that little move higher over that subsequent couple of trading days.
But very clearly here, market is in a downtrend—a lot of weakness going into earnings. And then, as that volatility kicks in and everyone responds to that new known information that’s hitting the market from the earnings reports, we see that acceleration of the downtrend.
Uh, so leading into this move, you see excellent levels as far as, “Hey, if you want to set a short, look up towards these predicted highs.” If you want to do some day trading, try to pull some out of the market, uh, but going into earnings, certainly wouldn’t want to be on the bullish side.
Then you see again, huge move out of earnings, and then those subsequent predicted highs and lows getting back on track, recognizing how things have shifted and helping traders adapt if they want to keep really expressing their trading ideas on that particular market.
So, uh, we’ll go ahead and leave it there for today. Once again though, this has been the hot stocks outlook for October 31st, 2025. Thank you all for watching. Best of luck out there, and bye for now.
Source link