The Ultimate VWAP Indicator Strategy – Best Intraday Indicator | Trading Strategy Guides
The Volume Weighted Average Price (VWAP Indicator) is a powerful and widely-used indicator in the trading world, particularly among institutional traders and algo-trading firms.
Retail traders love to use this indicator which is probably why you are here today!
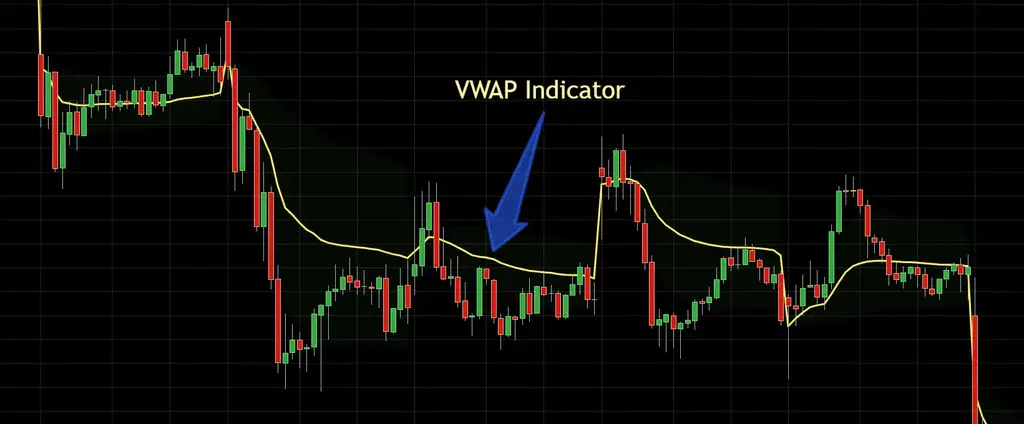
It looks like this on the chart.
Important Note** The VWAP will only show up on Intraday charts. So you will not see it if you are on the Daily or higher time chart.
VWAP is calculated using intraday data (typically from 1-minute or 5-minute intervals). It resets at the start of each trading day, making it less meaningful on higher timeframes like daily or weekly charts.
Which is why we will be using it on lower times frames in this strategy example.
It serves as a benchmark for the average price at which a security has traded throughout the day, taking into account both price and volume.
Unlike simple moving averages, which consider only price, VWAP offers a more comprehensive view by incorporating trading volume, making it an essential tool for assessing market trends and determining trade entry and exit points.
The significance of VWAP lies in its ability to reflect the true average price of a security, weighted by the volume traded at each price level.
This makes it a valuable metric for traders aiming to gauge market sentiment and execute trades in line with institutional activity.
By understanding and utilizing VWAP, traders can enhance their strategies, improve their decision-making process, and achieve better execution prices.
In this article, we will dig into the mechanics of VWAP, explore its practical applications in different trading scenarios, and provide insights on how to integrate it effectively into your trading strategy.
Whether you are a novice trader seeking to understand the basics or an experienced trader looking to refine your techniques, this guide will equip you with the knowledge needed to leverage VWAP for consistent and profitable trading outcomes.
VWAP Trading Strategy Rules
Okay, now let’s dig into the VWAP indicator strategy.
For this example today, we will be looking at an Apple chart (AAPL). We’ll also be using this on the lower time frames so pay attention to what time frame we note in each example.
Understanding VWAP on the Chart
When analyzing the AAPL chart, VWAP can offer insights into the stock’s intraday performance and help traders identify potential entry and exit points.
Here’s how:
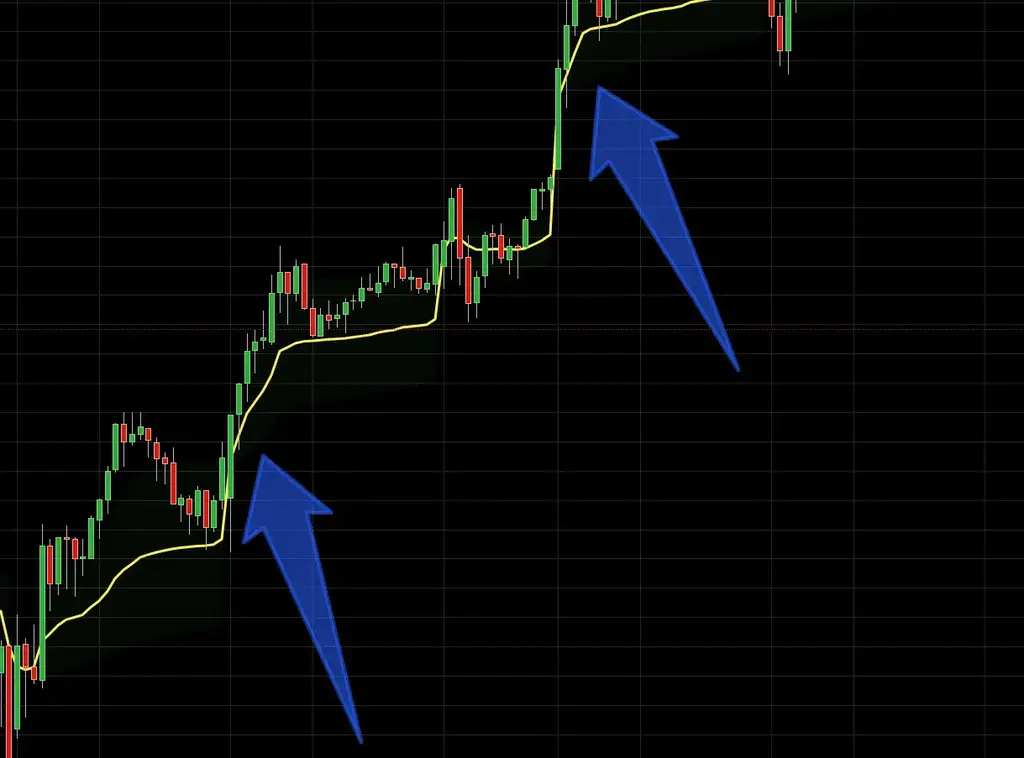
- Trend Identification: VWAP can help determine the overall trend of AAPL during the trading day. If the price is consistently above the VWAP line, it indicates a bullish trend, suggesting that buyers are in control. Conversely, if the price is below the VWAP, it indicates a bearish trend, with sellers dominating the market. Here is an example of what that would look like
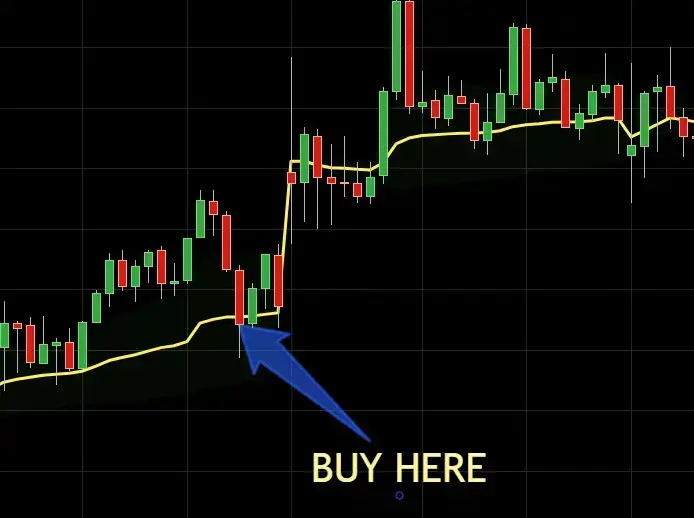
- Support and Resistance Levels: VWAP acts as a dynamic support and resistance level. When the price approaches the VWAP line, it often experiences a bounce or a pullback, making it a critical point for making trading decisions. For instance, if AAPL’s price is above the VWAP and then pulls back to it, traders might look for a bounce to go long. Like this, for example:
- Trade Execution: Institutional traders often use VWAP to ensure that their trade executions are in line with the average market price. By aiming to buy below the VWAP or sell above it, they can achieve better trade execution and reduce market impact. Retail traders can adopt similar strategies to improve their trade entries and exits.
- Volume Analysis: Since VWAP incorporates volume, it provides a more accurate picture of AAPL’s trading activity. By comparing the current price to the VWAP, traders can assess whether a move is supported by significant volume, indicating strong market sentiment, or if it’s likely to be a temporary fluctuation.
In the following sections, we will go deeper into the application of VWAP on the AAPL chart, providing step-by-step guidance on how to interpret the indicator, identify trading opportunities, and enhance your overall trading strategy using VWAP.
This guide will equip you with the knowledge needed to leverage VWAP for consistent and profitable trading outcomes.
VWAP Indicator Strategy Rule 1 – Apply VWAP Indicator
The first and most Important rule of the strategy is to get the indicator on your chart.
You can find the VWAP indicator on just about every trading platform out there. We will use TradingView VWAP indicator for our example.
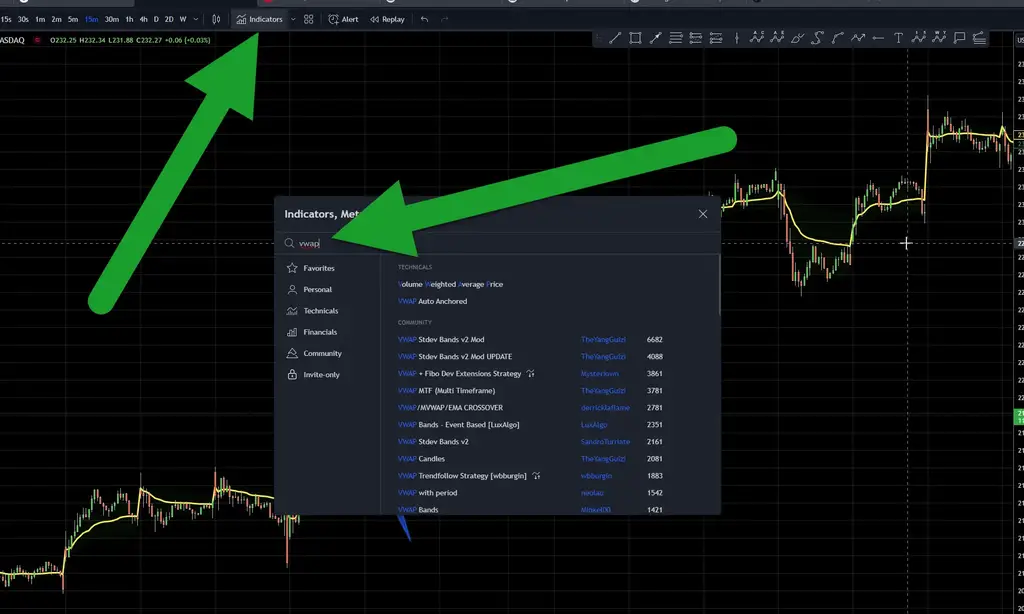
Here is where you find the VWAP indicator in TradingView.
Navigate to Indicators at the top of the chart and click on Technicals. Then search “VWAP” and click on Volume Weighted Average Price.
There are several custom VWAP TradingView indicators, but for us, we like the normal VWAP indicator that TradingView offers.
Adjusting the VWAP Tradingview Indicator
There is one minor adjustment to do before we can start.
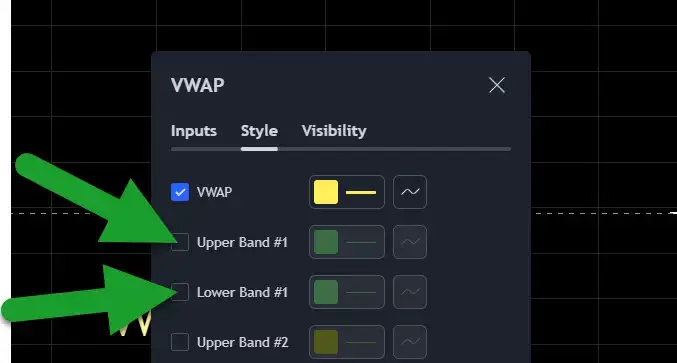
Click on settings and navigate to style.
The simply uncheck the Upper Band #1 and Upper Band #2
The bands on the VWAP (Volume Weighted Average Price) indicator, often referred to as VWAP bands or VWAP standard deviation bands, are similar to the concept of Bollinger Bands.
These bands are used to identify the range in which the price is expected to move and can help in spotting potential support and resistance levels.
VWAP Bands Explained
Lower Band: This is typically one or two standard deviations below the VWAP. It indicates potential support levels. If the price reaches this band, it might signal an oversold condition, where the security is trading below its average price weighted by volume.
Central Line (VWAP): The central line represents the VWAP itself, which is the volume-weighted average price of the security.
Upper Band: This is typically one or two standard deviations above the VWAP. It indicates potential resistance levels. If the price reaches this band, it might signal an overbought condition, where the security is trading above its average price weighted by volume.
We’ll remove the bands because they are not needed for this method of using the VWAP.
VWAP Indicator Strategy Rule 2 – Triangle Breakout Entry on M15 time frame
If you are unfamiliar with how triangles work, go ahead and click over to this article and read how to trade triangles.
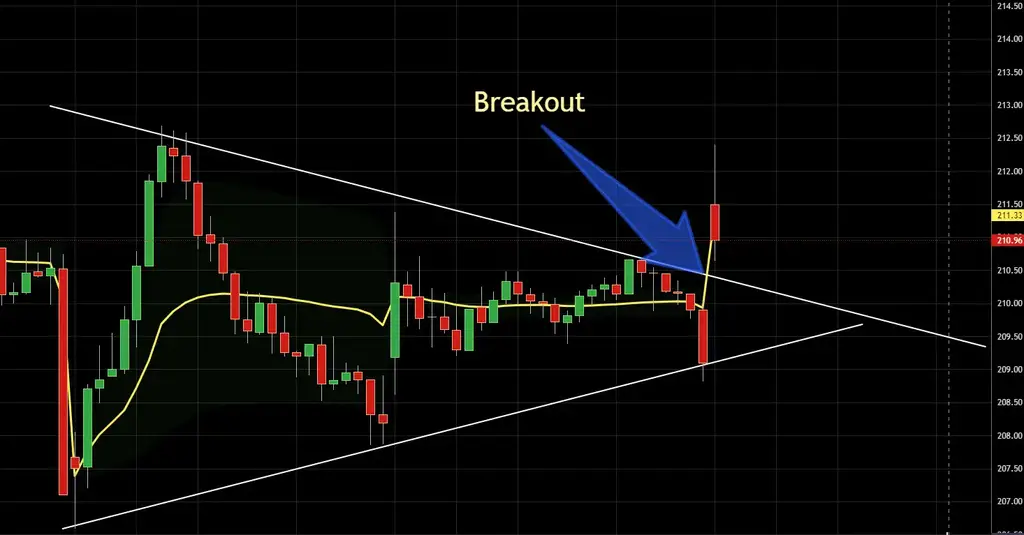
In this example we will be trading triangle breakouts with the VWAP.
Since we don’t ever just want to rely on one indicator to make trading decisions, using a price action pattern with VWAP is one of the best ways to use this indicator.
Once you get your triangle break entry, this is where you really start to see VWAP work.
If you are on Options trader you can take a short term Option play. Anywhere from 1-7 days out at the money call or put would be good.
If you are trading shares, just buy however many shares you can following your risk tolerance, of course. If you need to know the best way to manage risk, this article is a perfect guide for that.
**This strategy is not just meant for only Stocks. So you Forex, Commodity, and Crypto traders are all welcome to use the strategy.
VWAP Indicator Strategy Rule 3 – VWAP Is the ultimate trailing stoploss
This line is respected by many traders. Algos and Institutional traders. But why? Lets get into that.
Key Reasons VWAP is used by Institutional traders and algos
Institutional traders handle large orders that can significantly impact the market. VWAP helps them execute these large orders more efficiently by spreading them throughout the trading day to avoid moving the price too much.
VWAP provides a more accurate reflection of a security’s true average price throughout the day by weighting it with volume.
This makes it a fair price indicator, considering both price and volume, and is therefore trusted by institutional traders for decision-making.
Many algorithmic trading systems are designed to execute orders in line with VWAP.
These algorithms break down large orders into smaller chunks and execute them incrementally throughout the day to achieve an average price close to the VWAP.
This ensures that the market impact is minimized and orders are executed at a fair price relative to the day’s trading activity.
Since VWAP is volume-weighted, it inherently reflects periods of high liquidity.
Institutional traders prefer to execute trades when liquidity is high to reduce slippage and transaction costs. VWAP helps them identify these high-liquidity periods.
VWAP can also serve as an indicator of market sentiment and trend direction.
When the price is above the VWAP, it indicates a bullish sentiment, while a price below the VWAP suggests a bearish sentiment.
Many institutional clients and regulatory frameworks require that trades be executed at or near the VWAP to ensure fair dealing and best execution practices. Thus, VWAP serves as a standard for compliance and reporting.
It is universally applicable across different asset classes and markets, making it a versatile tool for institutional traders who operate in multiple markets and asset types.
The respect and widespread use of VWAP among institutional traders and algorithmic trading systems stem from its effectiveness as a performance benchmark, its ability to minimize market impact, its role as a fair price indicator, and its usefulness in identifying market sentiment and liquidity.
These factors collectively make VWAP a critical tool for achieving efficient and cost-effective trading outcomes.
So with that said, we want to use this line as much as we can.
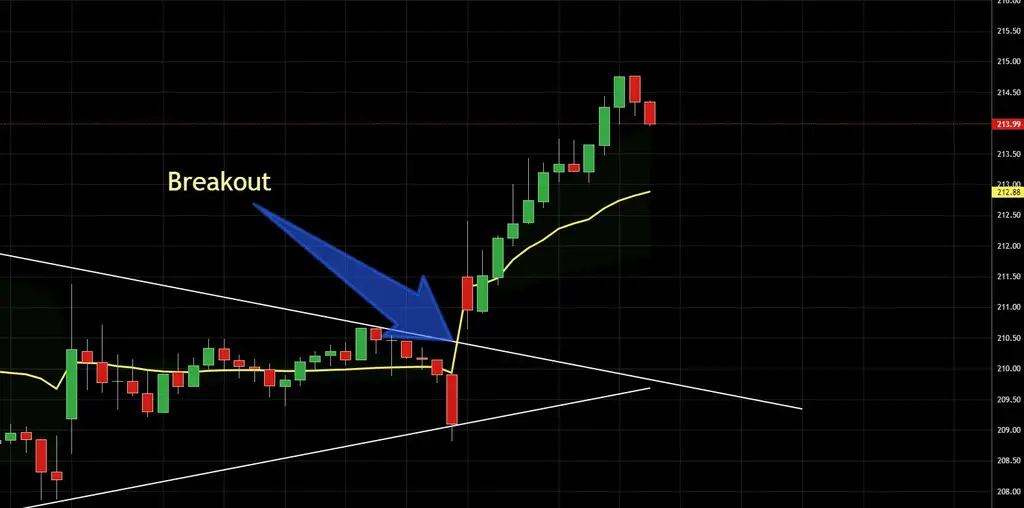
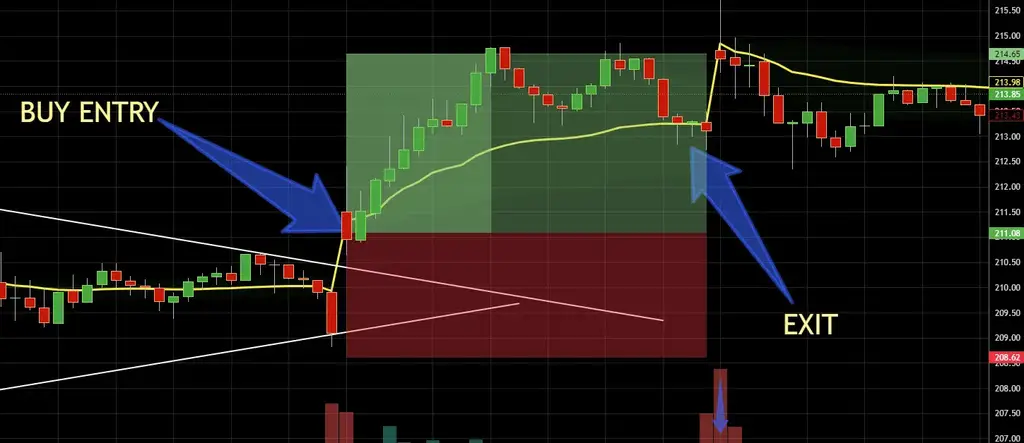
Once the triangle breaks on the 15 minute time frame, and you get your entry, here is how you can use the VWAP.
Price stayed above the VWAP for sometime as you can see on the chart above.
Once you start seeing price come back and start touching the VWAP line, there is most likely going to be a fight to stay above as there is a lot of trading activity happening here.
Like this:
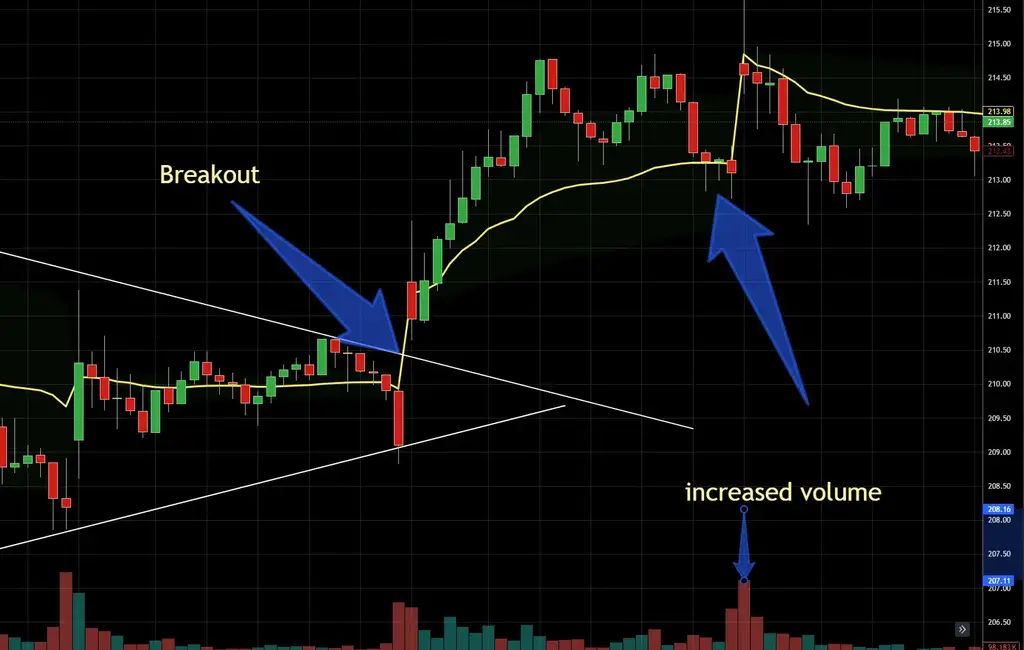
At this point when price hits the VWAP line, This is a great place to exit the trade.
Remember, we are only on the M15 time frame, so why risk seeing this fall back down and breaking the VWAP.
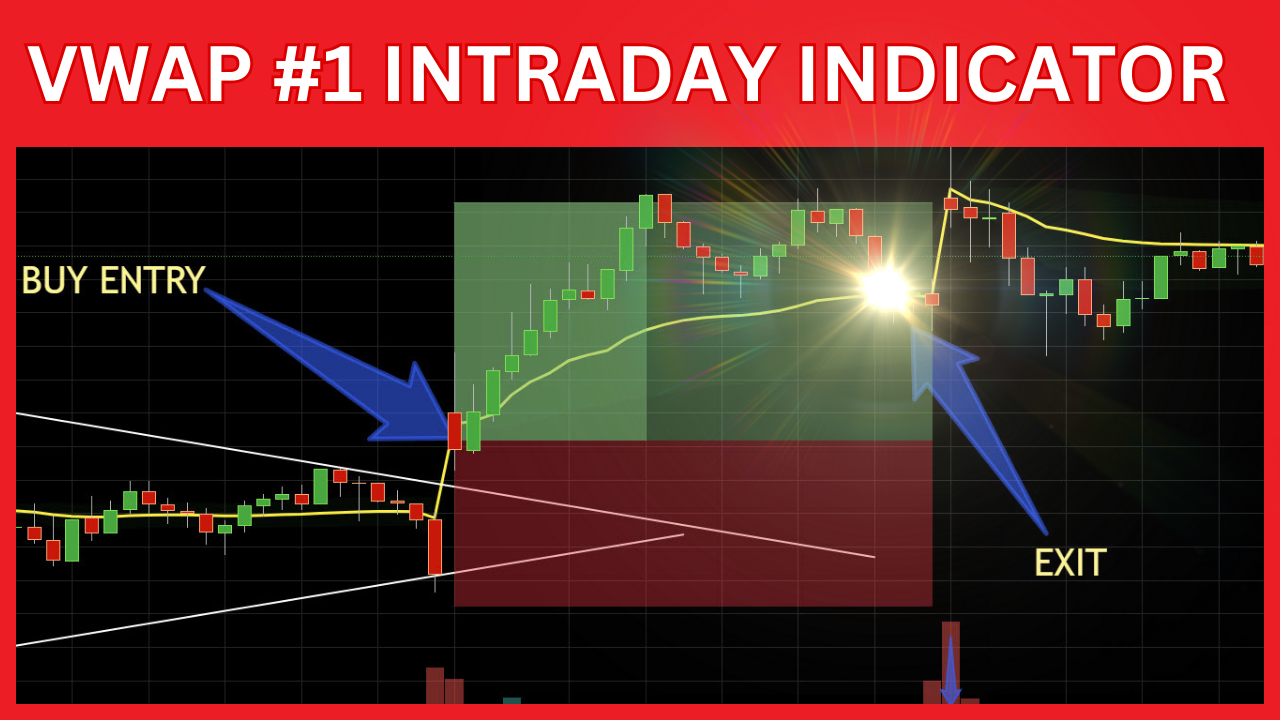
Here is the exact entry and exit for this example:
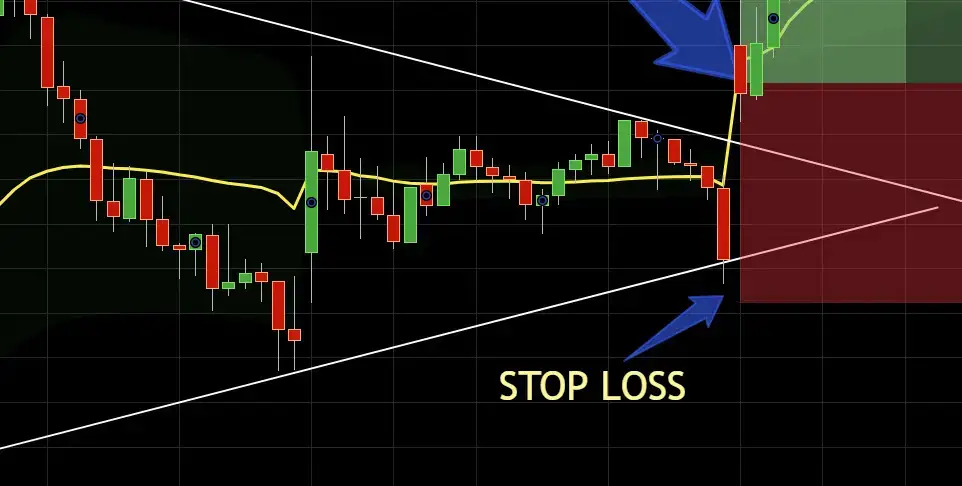
Remember, we are using an entry criteria that follows a triangle breakout pattern.
So you can follow the initial stop loss recommendation from this strategy on our blog.
But, if you want to see exactly where our SL recommendation was on this example it is below the swing low before the triangle breakout.
The purpose of VWAP in this strategy is to get out exactly when the momentum has shifted against you.
VWAP Indicator Explained Youtube Video Tutorial
Conclusion of VWAP Triangle Breakout Strategy
The VWAP Triangle Breakout Strategy leverages the strengths of the VWAP indicator and the technical pattern of the triangle formation to identify profitable trading opportunities.
By combining these elements, this strategy aims to pinpoint moments of increased market activity and potential price breakouts, which are crucial for making informed trading decisions.
In this strategy, VWAP serves as a reliable benchmark for fair value, incorporating both price and volume data.
This helps traders distinguish between normal price fluctuations and significant market movements.
The triangle formation, whether ascending, descending, or symmetrical, highlights periods of consolidation, signaling that a breakout is imminent.
When the price breaks out of the triangle formation and crosses the VWAP, it indicates a strong directional move supported by volume. This confirmation adds confidence to the trade, reducing the likelihood of false breakouts. The strategy is adaptable to various timeframes, though it is particularly effective in intraday trading due to the real-time nature of VWAP calculations.
Institutional traders and algorithmic systems often employ VWAP to ensure trades are executed at favorable prices, minimizing market impact. By integrating VWAP into the triangle breakout strategy, traders can align their actions with the practices of these large market participants, enhancing the strategy’s robustness.
The VWAP Triangle Breakout Strategy is a powerful tool for traders seeking to capitalize on market momentum and volume-driven price movements. By using VWAP as a dynamic support and resistance level in conjunction with triangle patterns, traders can identify high-probability breakout opportunities and improve their overall trading performance.
Source link