Weekly Charts Analysis – Forex Forum
Weekly Charts Analysis
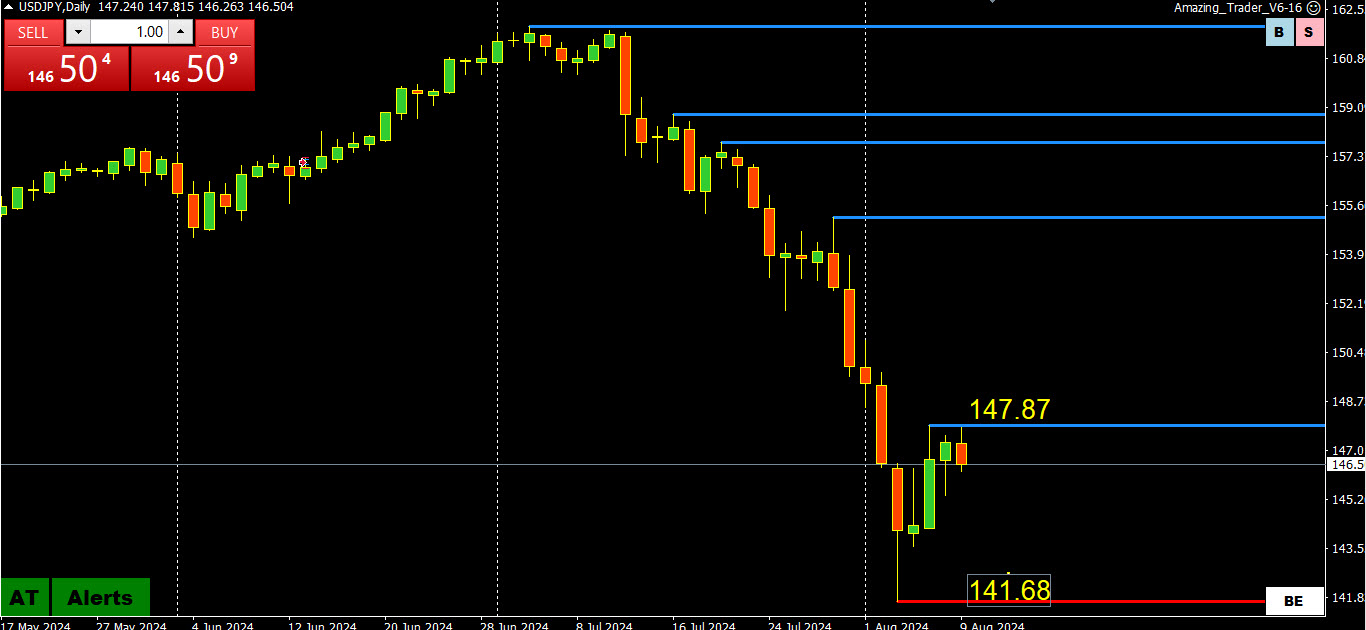
USDJPY DAILY CHART – Time to take a breather?
USDJPY pattern is 5 down weeks in a row. To break this pattern, 147.90 would need to be broken. Otherwise, there could be an inside week.
On the downside, if I was the BoJ, I would look to defend the 141.68 low.
Current consolidation range is 144-148 (could be tighter at 145-148).
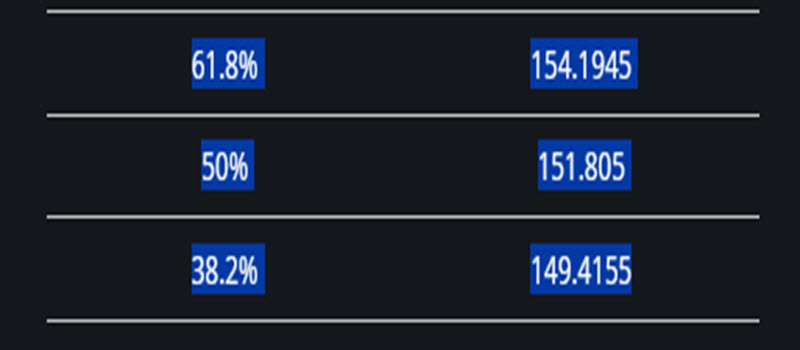
Just in case, here are the current retracement levels
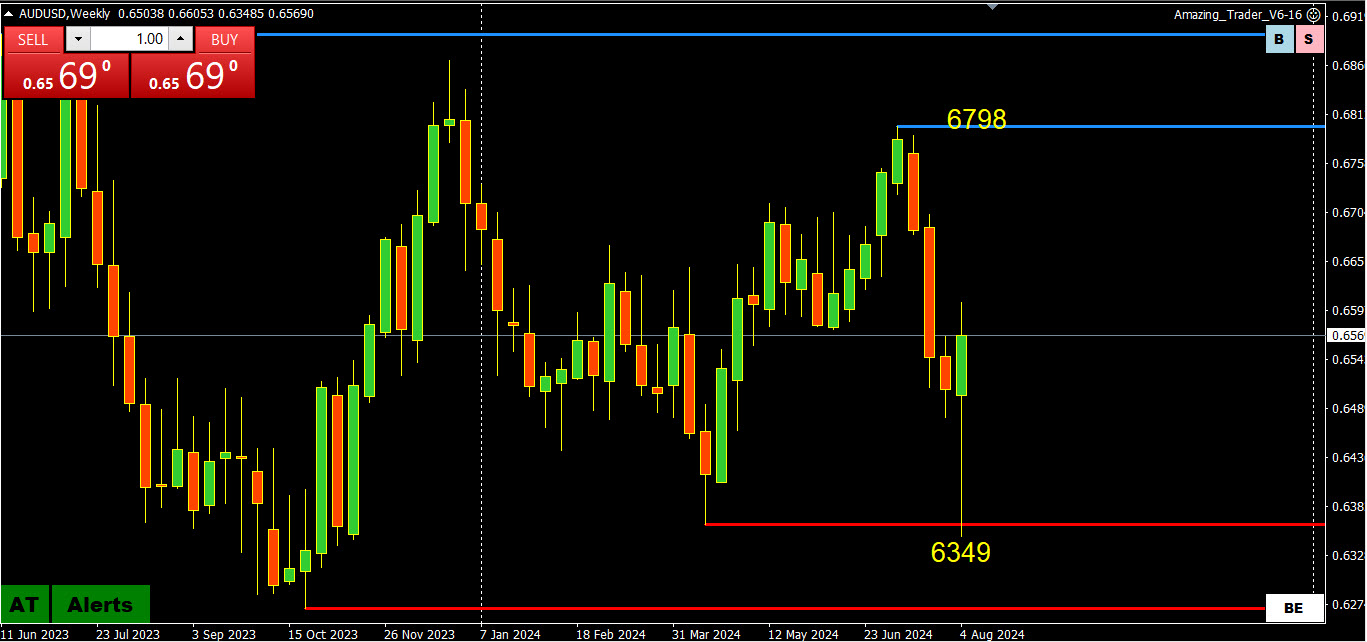
AUDUSD WEEKLY CHART – More than a retracement
The best I can say is the low is in at .6349
On the upside, keep an eye on .6626, which is the 61.8% retracement level (.6798-.6349)
Otherwise, if within .6500-.6600, look for support as long as it is above .6500 but to keep .6600+ at risk, it needs to trade above ,6550.
Friday’s high was .6605
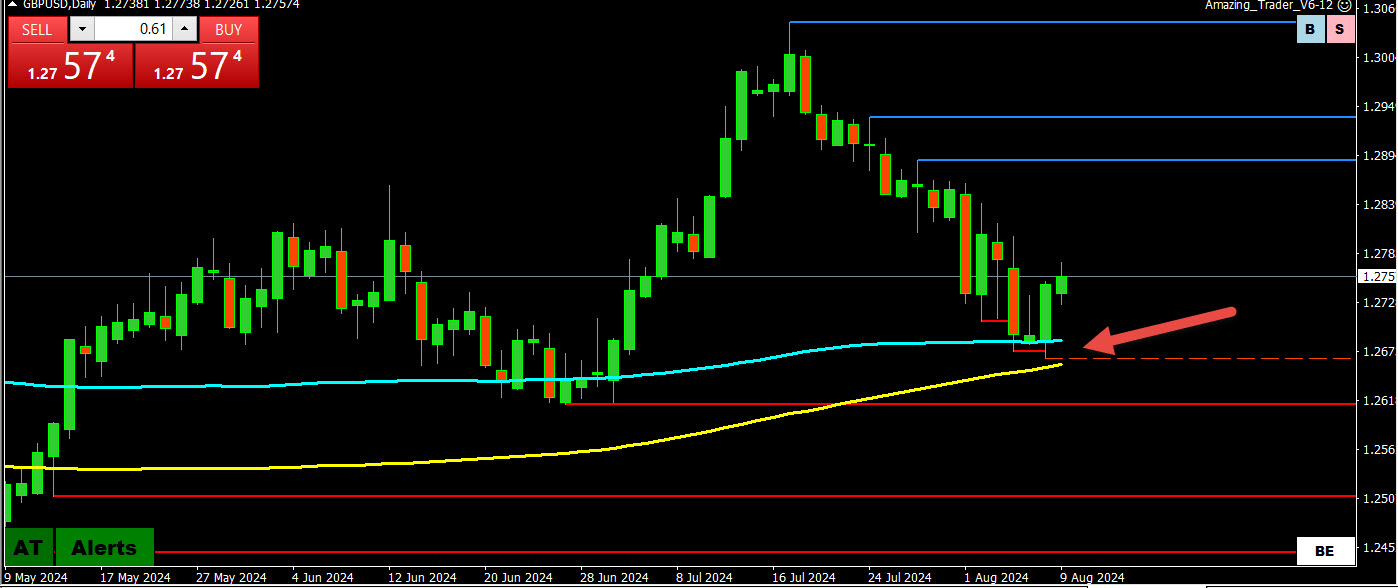
GBPUSD DAILY CHART – MOVING AVERAGES CHECK THE DOWNSIDE
GBPUSD bounce from the 100 (blue) and 200 (yellow) moving average band would need to regain 1.28+ to expose resistance (1.2800-20) and retracement levels as shown below.
On the downside. 1.27 is a pivotal level that needs to trade above to keep a new found bid. Below it is key support is at the 1.2664 low and the major 1.2612 support.
There is a full UK economic calendar this week so the reaction will dictate whether GBPUSD has found a bottom.
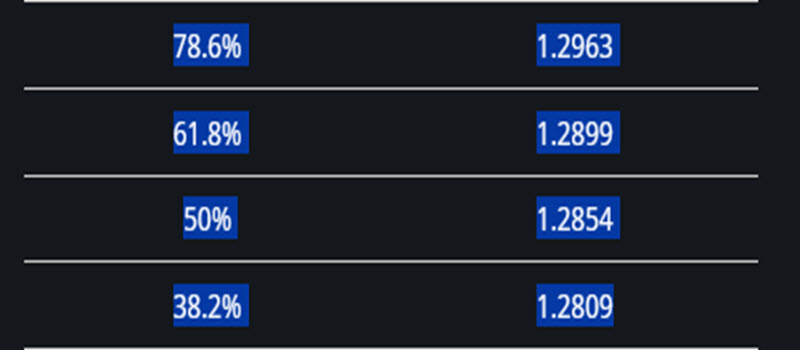
GBPUSD retracement levels:
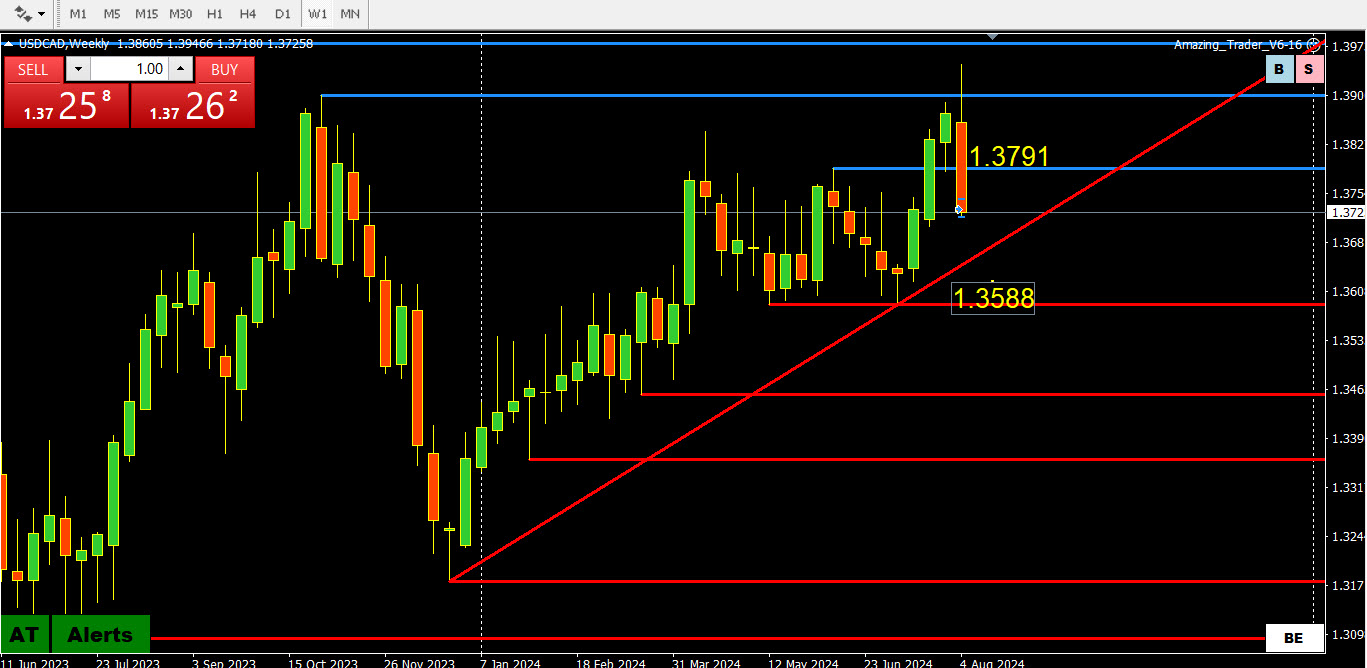
USDCAD WEEKLY REPORT – Retracing
Daily support 1.3656
Key weekly support 1.3588 and the trendline
If it trades within 1.37-1.38, back above 1.3750-60 would be needed to shift the focus back to 1.3790-00.
Weekly Charts Analysis
Become a Member of our Trading Club and get The Amazing Trader Charting Algo for Half a Price !
Join The Trading Club HERE
Get your Free Trial for The Amazing Trader HERE
Source link