Weekly Charts Analysis 12.08.-16.08. – Forex Forum

Weekly Charts Analysis 12.08.-16.08.
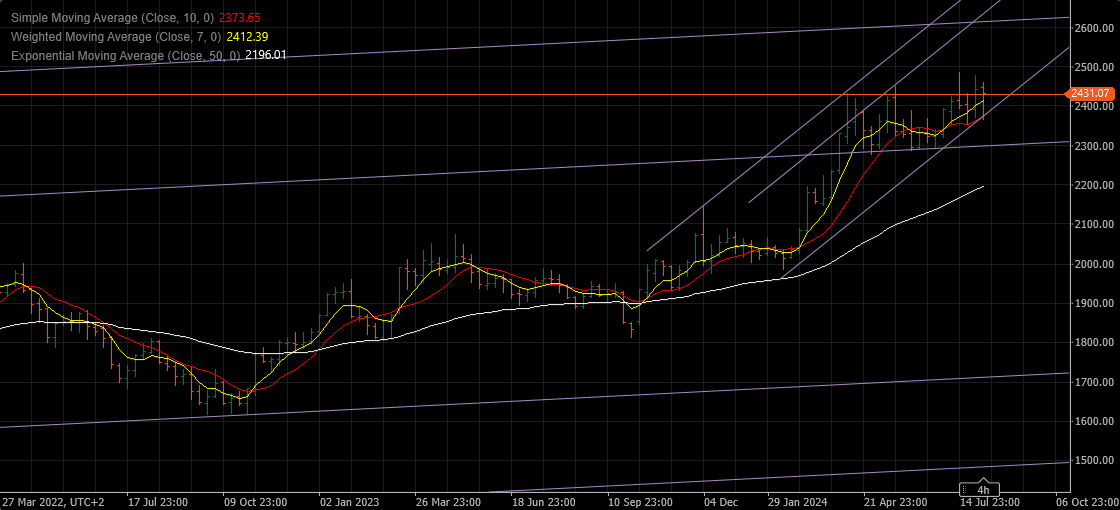
XAUUSD – Gold Weekly Chart
Supports : 2415.00 , 2395.00 & 2300.00
Resistances : 2460.00 , 2475.00 & 2490.00
Weekly close indicates continuing Bullish sentiment and possible break out over 2500.00
In such a case, next hurdle is at 2600.00
Only break below 2300.00 would put an end to this Bullish run.
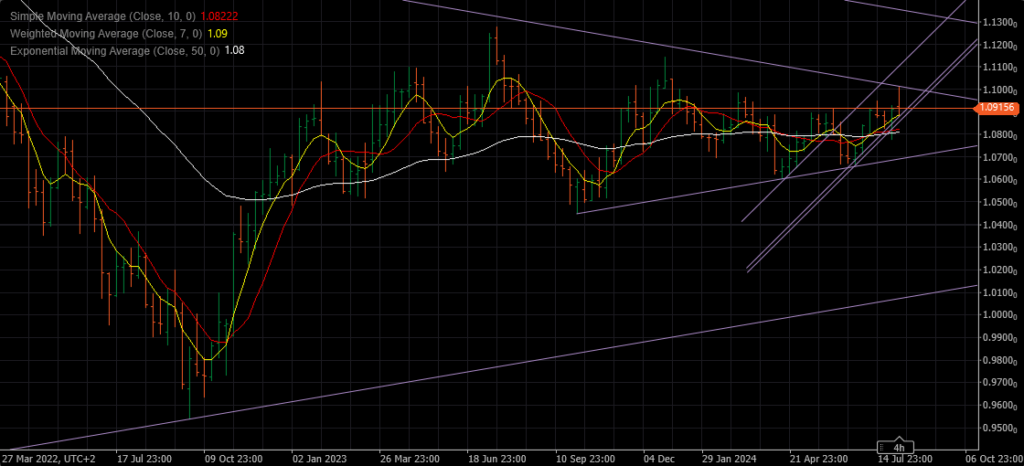
EURUSD Weekly Chart
Supports : 1.08815 , 1.08500 & 1.07700
Resistance : 1.09500 , 1.10000 & 1.10450
The weekly close is somewhat Bearish as a Pattern, but I have seen too many times for pair to continue Up from exactly this position.
So two main levels will decide the near future :
- Support at 1.07700
- Resistance at 1.10000
Problem is obviously lack of interest , as previous Monday-Tuesday Move was so clearly Bullish , but ended up lame and without any strength.
Next week we have quite a few Big Data coming from : USA, UK & EU , so we’ll have lots of action for sure.
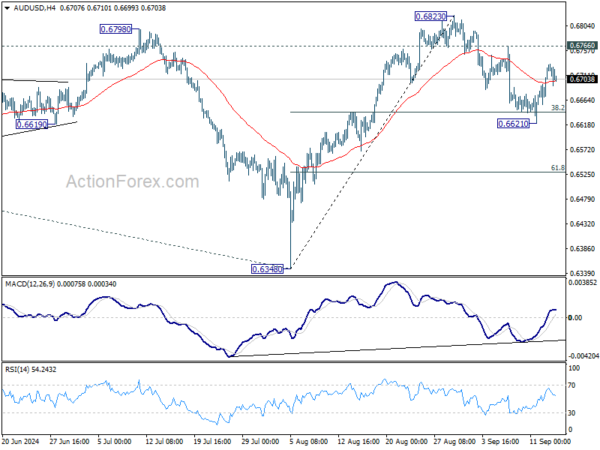
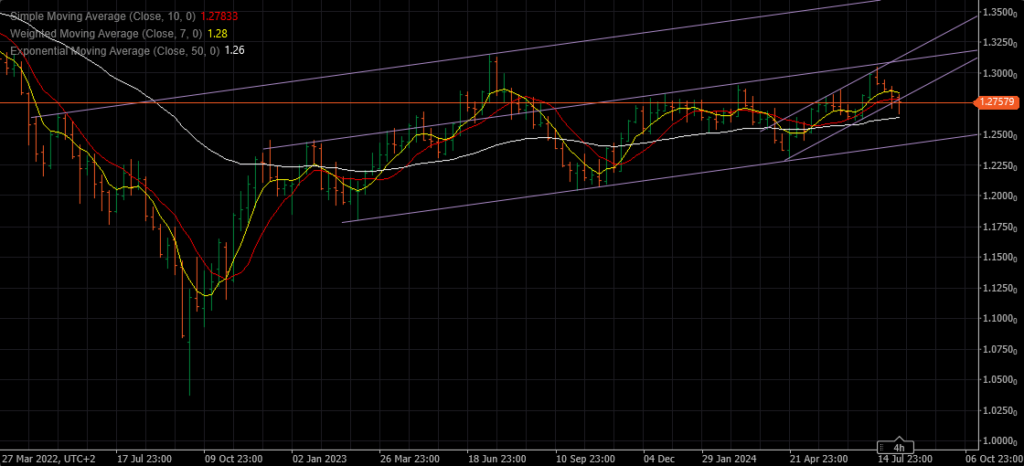
GBPUSD Weekly Chart
Supports : 1.26650 , 1.26450 & 1.24200
Resistances : 1.28150 , 1.29050 & 1.29500
Even the Inner channel trend line was broken, as long as above 1.26450 Cable can hit higher.
Most important resistance right now is at 1.28150.
In the case supports hold the ground, it needs to overcome 1.30500 to get a momentum for more advances.
However, looking at it from early 2023. It looks just like a sideways correction …
Next week it has to show us the direction.
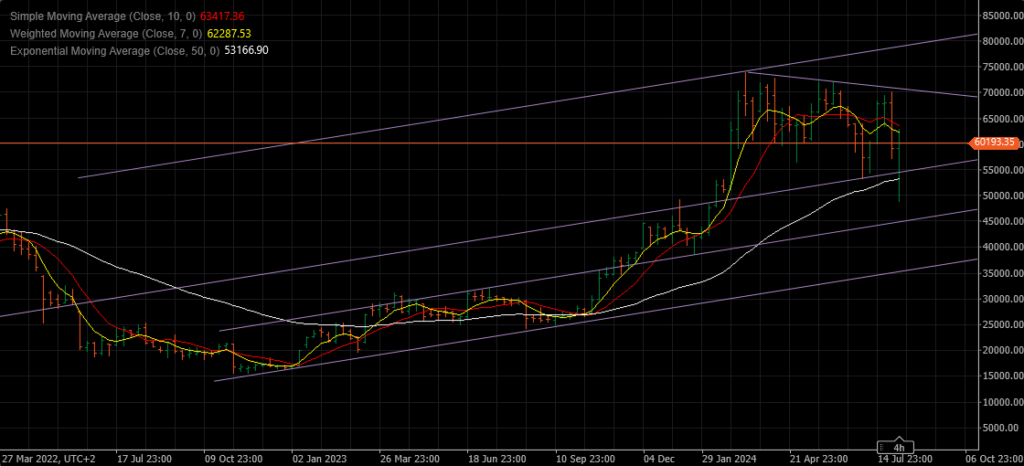
BTCUSD Weekly Chart
Supports : 57.000 , 55.250 & 50.450
Resistances : 61.800 , 64.500 & 70.500
Obviously there is a lot of interest in Buying Bitcoin, but technically this doesn’t look good for it.
As long as below 70.500 it is destined to test lower , even as low as 36.250
If it manages to climb above 64.500 and finds a footing there, it would be possible to see a run at 80.000 – but don’t hold your breath for too long…
Next week is a deal maker/breaker – watch it closely
Weekly Charts Analysis 12.08.-16.08.
For Daily updates and Tips on trading Intraday Join Our Trading Club HERE
To get your FREE Trial of The Amazing Trader Charting Algo Click HERE
Follow our Blog for more insights in Forex Trading
Source link