Weekly FX Chart Outlook: September 2. 2024 – Forex Forum
Weekly FX Chart Outlook: September 2. 2024
Summer is over – USD shorts got washed out – New ball game.
What I have done is suggest some broad ranges in a week that will be full of data but just a sparring match until Friday’s US August jobs report. The jobs report, depending on the outcome, could influence expectations for the size of the Fed’s September rate cut and the total of cuts expected for the rest of the year.
In this regard, current market pricing is for a 25bps rate cut in September and 100 bps in total the rest of the year (vs. economists leaning towards 75bps).
Note the start of a new quarter and post-summer often sees false starts and whipsaws until market ssettle on a theme and recover full liquidity.
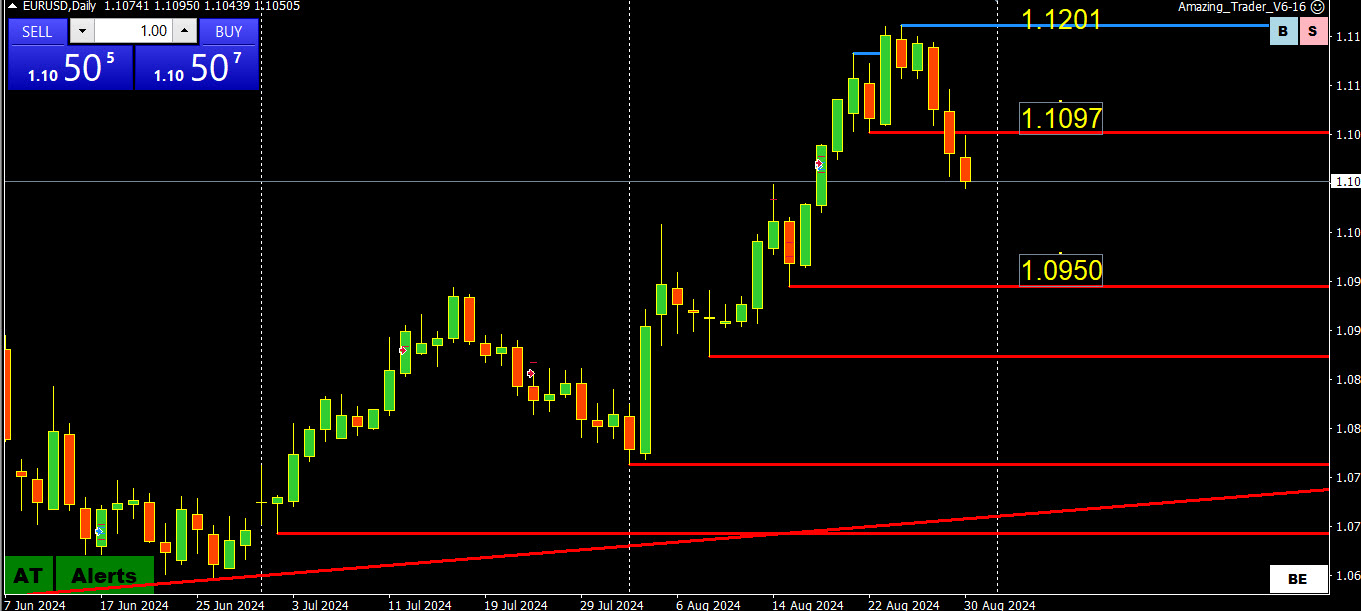
EURUSD DAILY CHART – High is in
Assuming the high is in at 1,12, what is the risk on the downside?
Start out by using 1.10-1.12 as a range to the post summer market with 1.11 as the neutral mid-point and the ultimate bias setter for this currency.
.Currently, 1.1050 will set the tone if trading between 1.10-1.11 but expect a limited upside unless 1.1+ is renewed
Weekly FX Chart Outlook: September 2. 2024
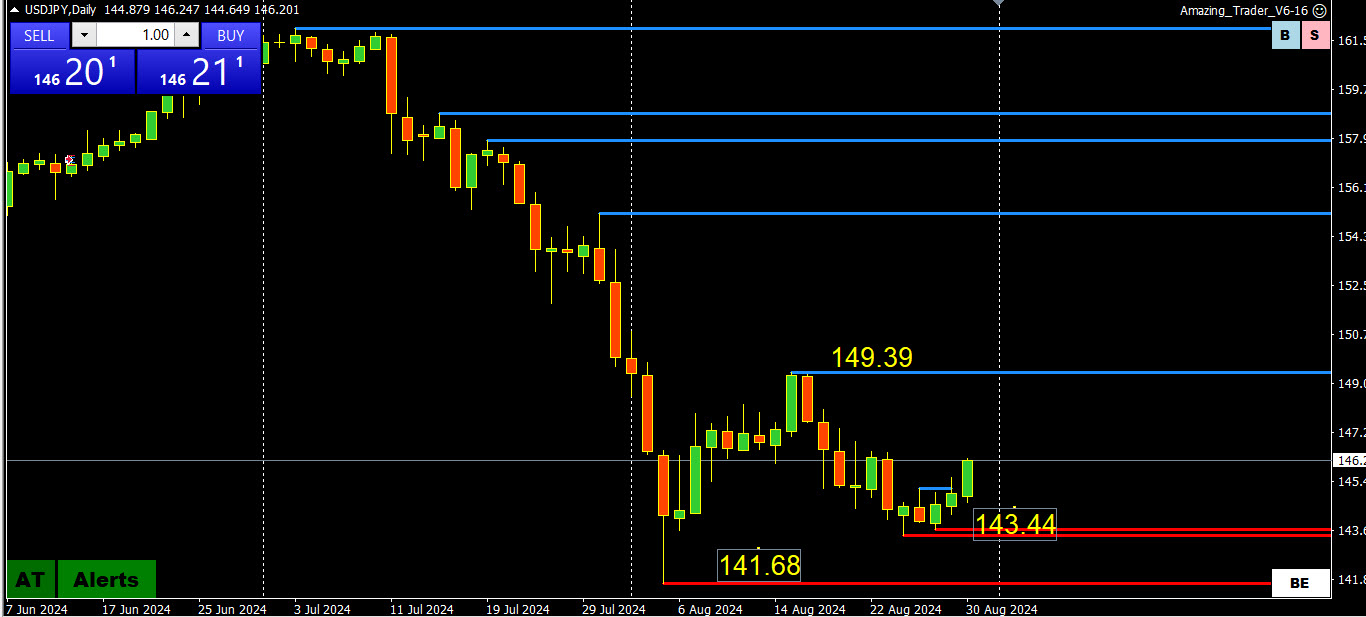
USDJPY DAILY CHART – BULLISH ABOVE 145.00-50
Using 143.50-146.50 as a range, 145 is the neutral midpoint that will dictate the tone going forwards.
A break of this pattern would be a bullish sign but only if 145.50 can become support, which in turn would put 146.50 (see 4 hour chart) at risk
Broad range is still 141.68-149.36
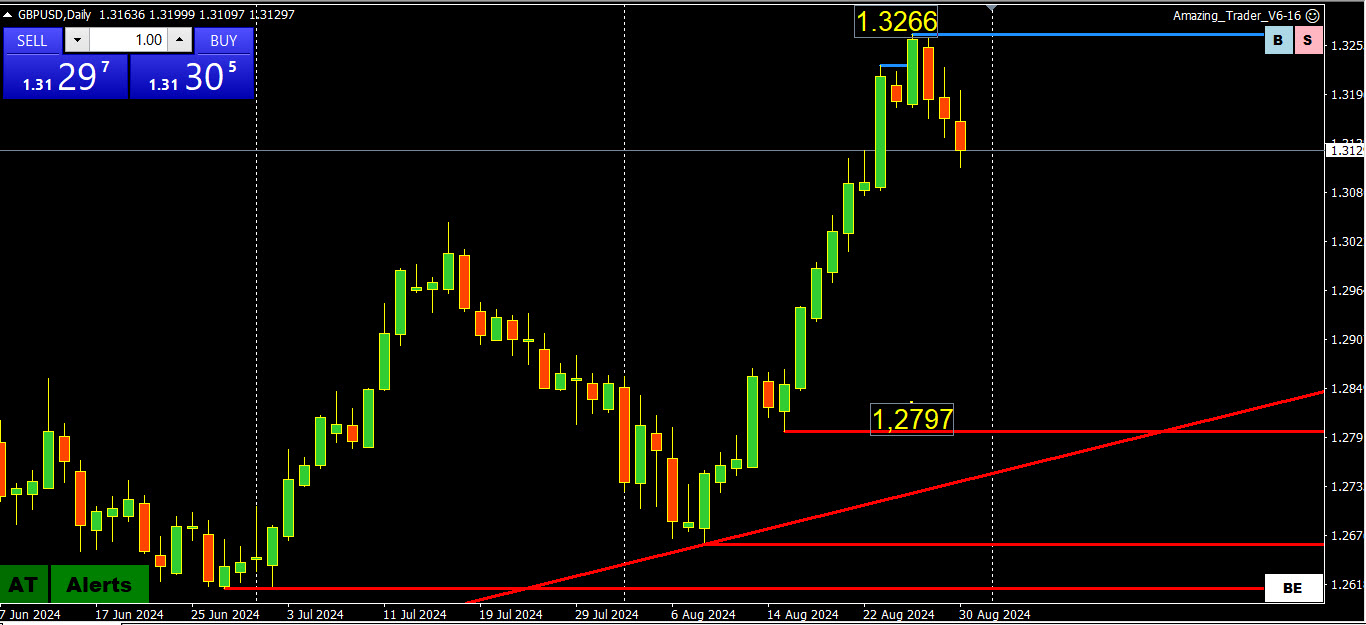
GBPUSD DAILY CHART – HIGH MAY BE IN
If I had to pick a range for GBPUSD I would say 1.30-1.33 but if you wanted to tighten it, then try 1.31-1.33, where 1.32 is the neutral midpoint, If 1.30-1.33 then 1.3150 is the midpoint.
In any case the high appears to be in (1.3266) but only below 1.30 would suggest a risk of a reversal.
Given the absence of nearby supports after the straight line move up, use our FIBO calculator for retracements to find levels of potential support.
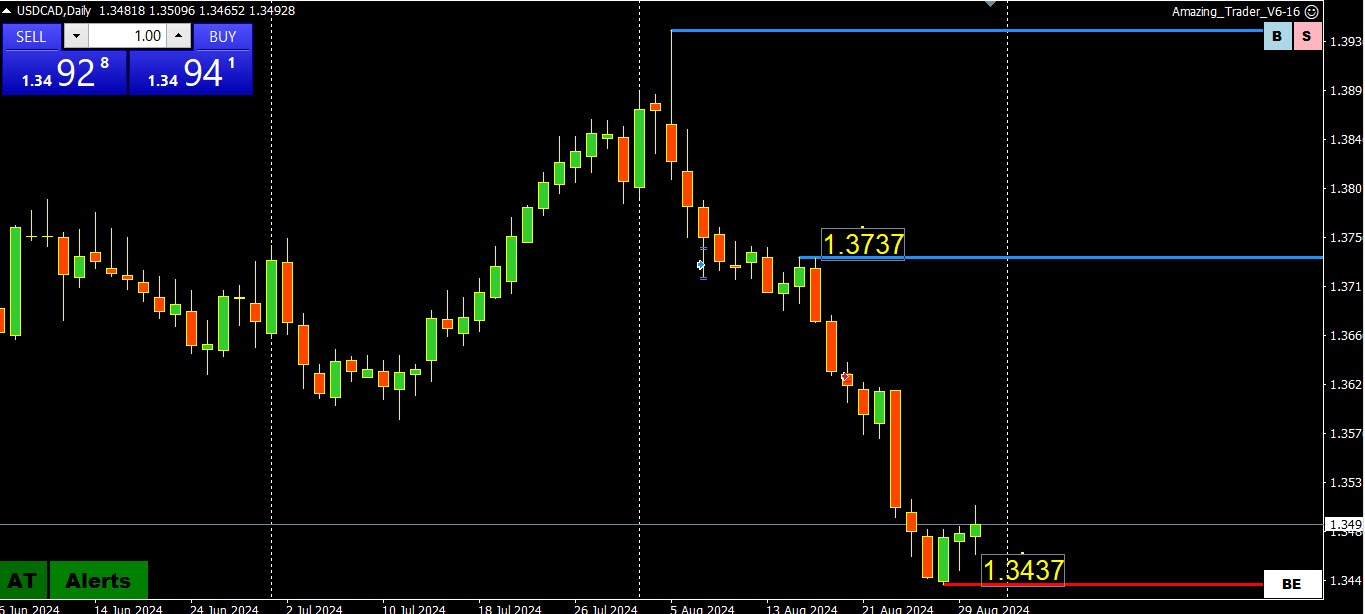
USDCAD DAILY CHART -Watch 1.35
Look for the focus to be on the BoC meeting on Wednesday where a rate cut is widely expected.
In the meantime, 1.35 is one of those pivotal levels that would need to be solidly renewed along with a break of 1.3515 to suggest the bottom is in for now.
Given the absence of nearby resistance after the straight line move up, use our FIBO calculator for retracements to find levels of potential resistance beyond 1.35..
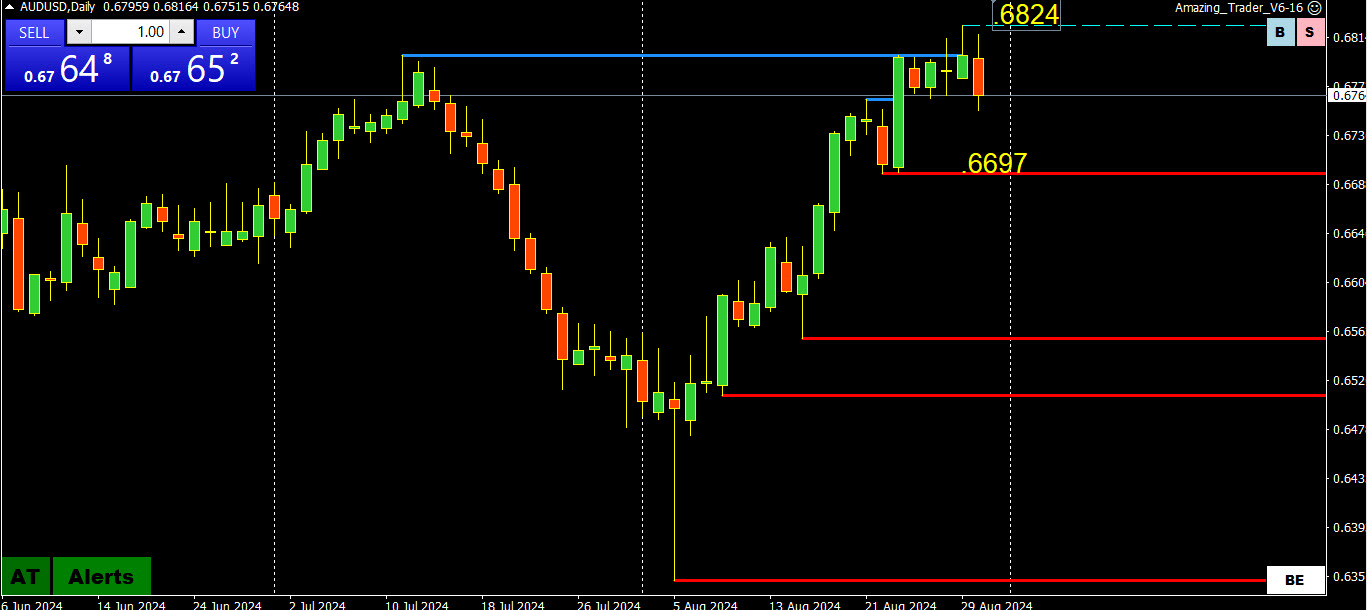
AUDUSD DAILY CHART – Failed to .68+
The failure to hold .68+ has cooled the upside but only a break of .6697 would confirm the high is in.
Immediate support is at .6750, which needs to hold or focus shifts away from .68..
.
Further down, only a break of .6697 would confirm the high is in.
Weekly FX Chart Outlook: September 2. 2024
Get your FREE Trial for The Amazing Trader Algo Charting System ( If you are already a member of our Club, you can get it for 50% of the regular price )
Click HERE to get a Free Trial
Source link