
The New Inflation Regime
Funtap/iStock via Getty Images
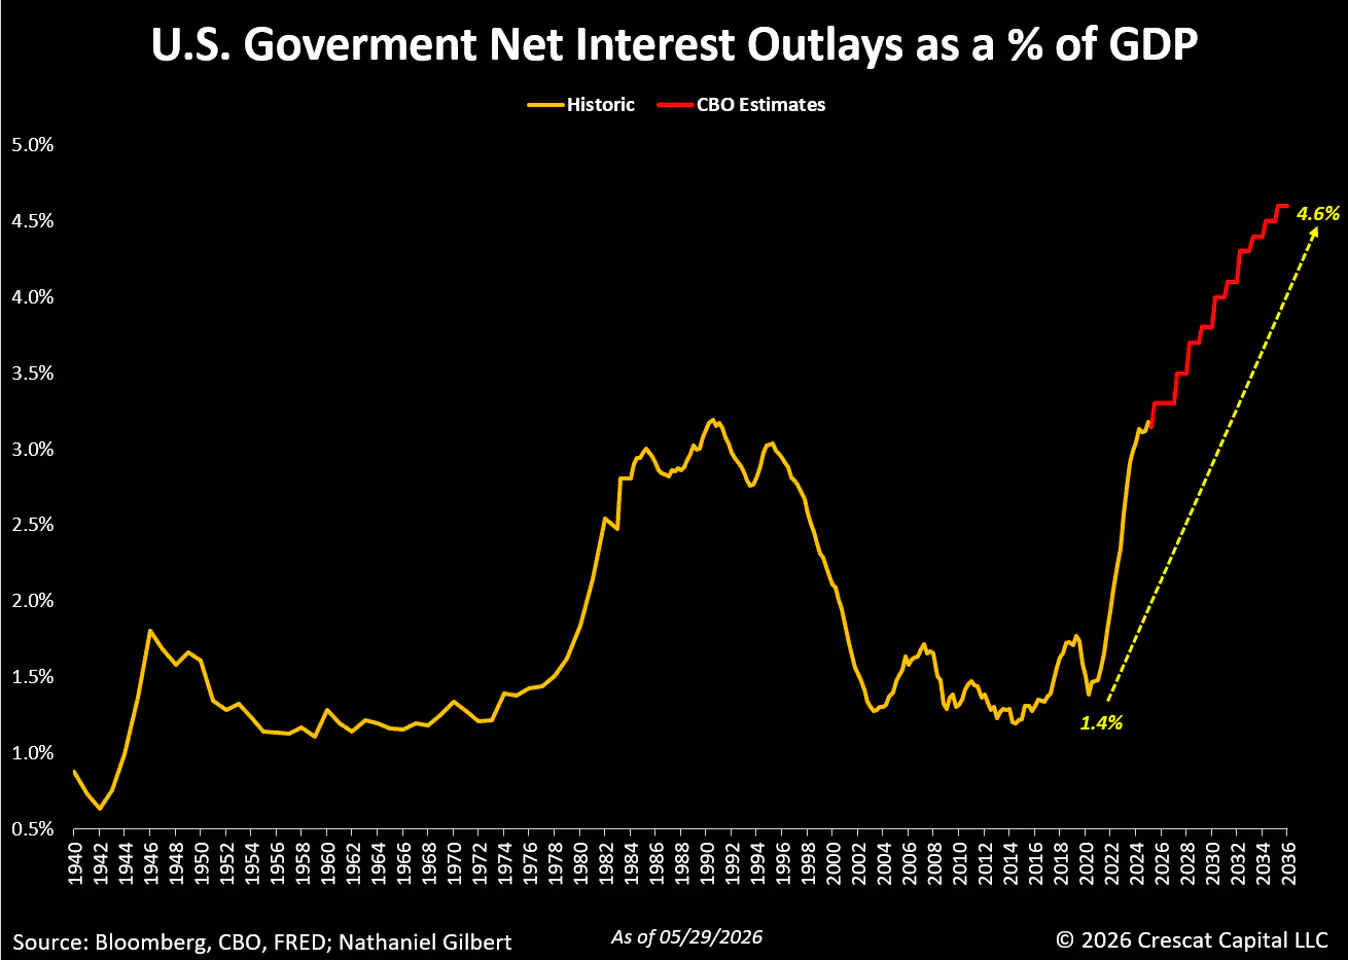
The interest payments required to fund the US government debt are becoming a real problem. Since 2020, net interest outlays as a percent of GDP have risen from 1.4% to 3.1%, and the Congressional Budget Office (CBO) is projecting this ratio to grow to 4.6% by 2036. The CBO published its budget and economic outlook for 2026 to 2036 in February of this year. Note, the CBO’s economic outlook for the next decade has Treasury yields contained at a level between 3.1% and 3.3% for 3-year maturities and between 4.1% and 4.4% for riskier 10-year maturities. If interest rates were to rise above these levels, due to rising inflation expectations, the net interest cost as a percent of GDP in the CBO’s projections would be even higher.
Frightening CBO Projections
The United States government running a budget deficit is nothing new. Our country has been funding persistent government deficits through debt issuance for the vast majority of its history since the Great Depression. But the character of the likely future high magnitude and persistence of the deficit has materially changed since the pandemic.
Starting from 5.9% for 2025, the CBO projects the fiscal deficit to grow to 6.7% of GDP by 2036, with the deficit averaging 6.1% over the 10-year stretch from 2027 to 2036. Using Federal Reserve data going back to 1929, the two longest continuous periods of the federal budget deficits greater than 6% of GDP were for just five years during and immediately after World War 2 from 1942 to 1946, and then for just four years in the aftermath of the Global Financial Crisis (GFC), from 2009 to 2012.
The first period, due to World War 2, was a high inflationary regime led by necessary financial repression, i. e. , government-suppressed interest rates, also referred to by economists as “fiscal dominance”. The second period, post-GFC, was necessary due to the collapse of the U. S. housing market, causing large-scale emergency spending and tax cuts to stimulate demand and avert a complete collapse of the financial system. Contrary to widespread fears at the time, the large fiscal stimulus and money printing in the wake of the GFC did not lead to a new regime of rising inflation.
Congressional Budget Office Baseline Budget Projections, by Category
Source: Congressional Budget Office, February 2026

COVID Pandemic Spurs First Wave of Inflation in the New Regime
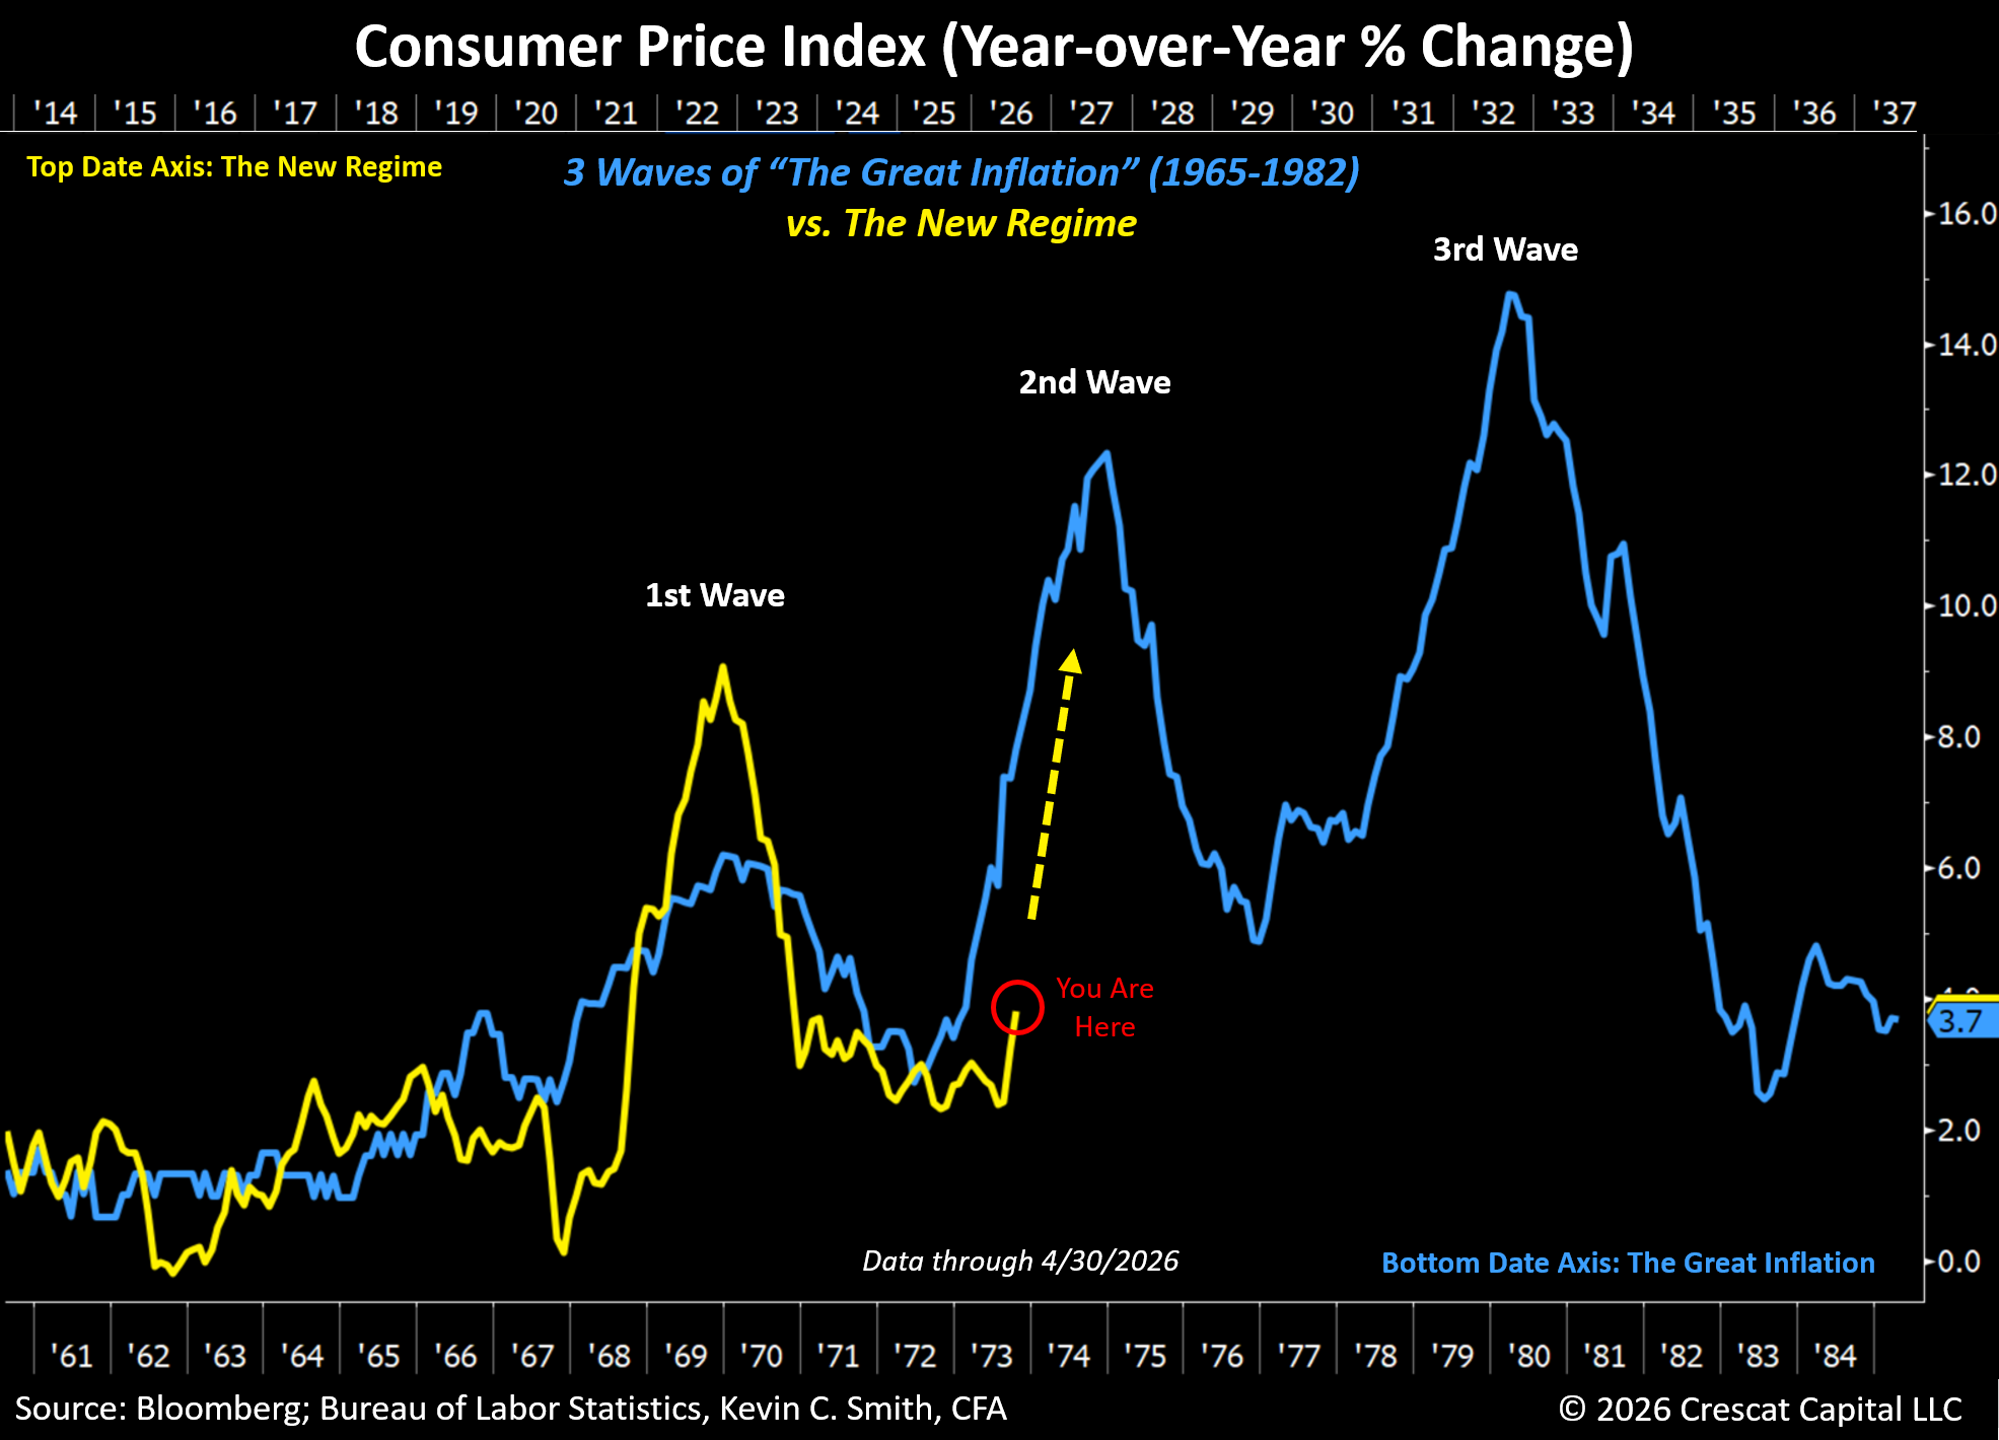
In the wake of the COVID stimulus, we believe the long-term macro inflationary dynamic has changed entirely to one of persistently entrenched fiscal imbalances. Therefore, in our analysis, the sharply rising inflation from 2020 to 2022 marks what should only be the first wave of a new secular inflationary regime. Past US inflationary regimes have had wave-like characteristics, including both during the post-Great Depression and WW2 era, and during “The Great Inflation” from 1965 to 1982.
Today, the economy appears strong. In many investors’ minds, it seems that the Federal Reserve’s interest rate hikes in 2022 and 2023, and its balance sheet reduction from 2022 to 2025, have worked to contain inflation expectations today. On the contrary, for us, the fact that the Federal government is forced to run an unusually large fiscal deficit during a supposedly robust economy is a major inflationary concern.
After “The Great Inflation”, it took the first 20 years (1981 to 2000) of a 40-year disinflationary regime (1981 to 2020) to finally convince the world that US policy makers had conquered inflation. How many years will it take for people to believe that we are in a new secular inflationary regime? Until rising inflation expectations become embedded in the economy, that’s when, but we are far from it today. Long-term inflation expectations based on the 10-year-TIPS yield are only 2% today, but that is only “expected CPI”, a number that can be manipulated by government statisticians. We encourage investors to look to the precious metals markets for a clearer leading indicator of rising inflation expectations.
Now, still with no clear conclusion to the wars in Ukraine and Iran, and an Administration pushing for continued aggressive fiscal and monetary stimulus, we believe it is just the beginning of the second wave of inflation.
Impossibility of Managing Fiscal Imbalances Without Financial Repression and Inflation
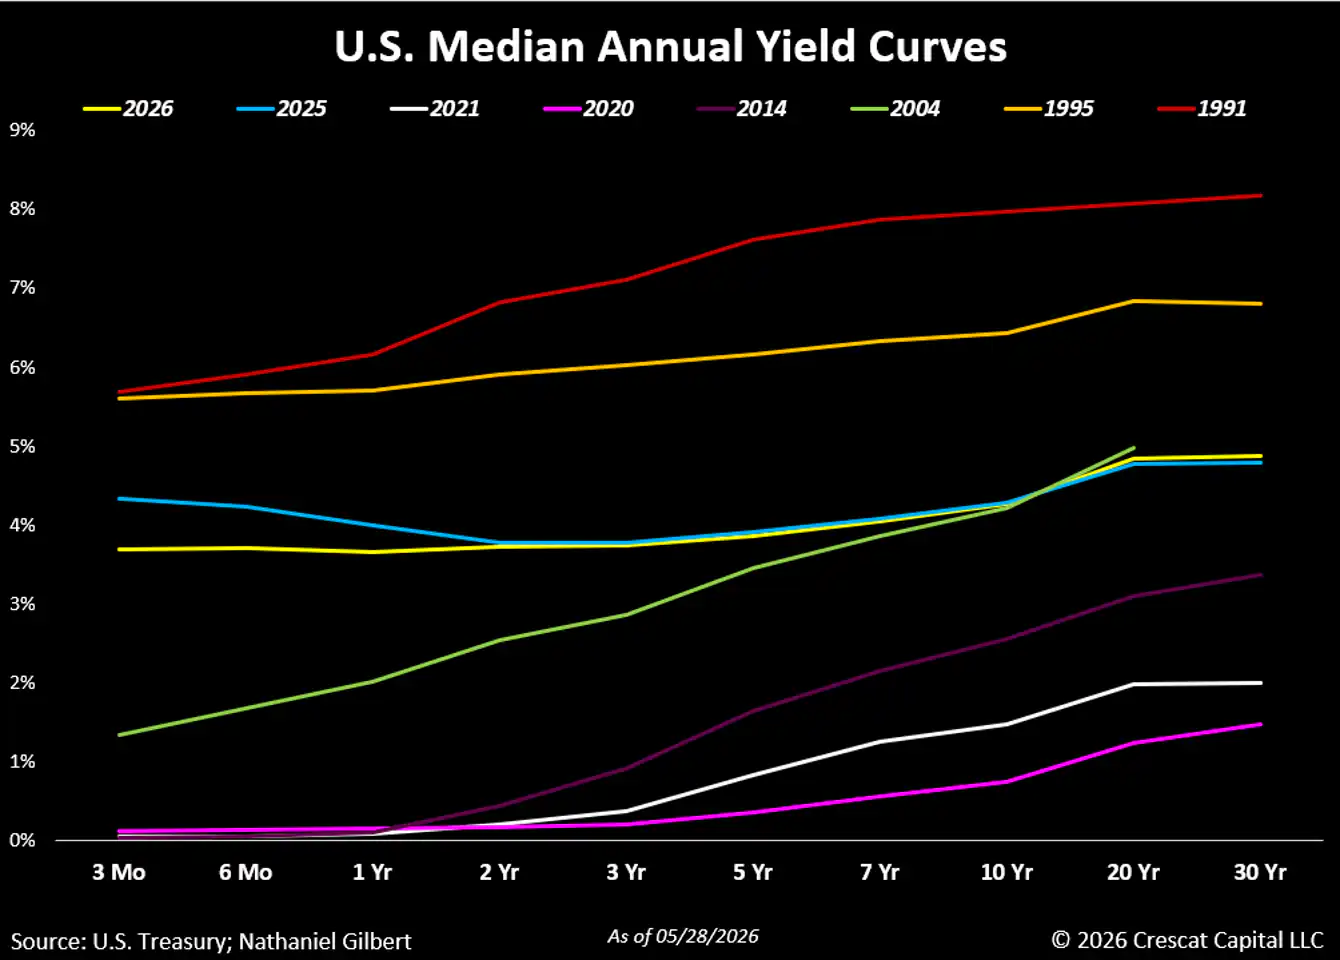
For much of the mid 1980’s through mid 1990’s, net interest as a percentage of GDP was comparable to today, although there are some notable differences. Yields during that time frame were much higher than they are today. On average across the curve, yields were around 2% higher in 1995 and 3% higher in 1991 compared to today.
Higher Interest Rates Would be All-Consuming
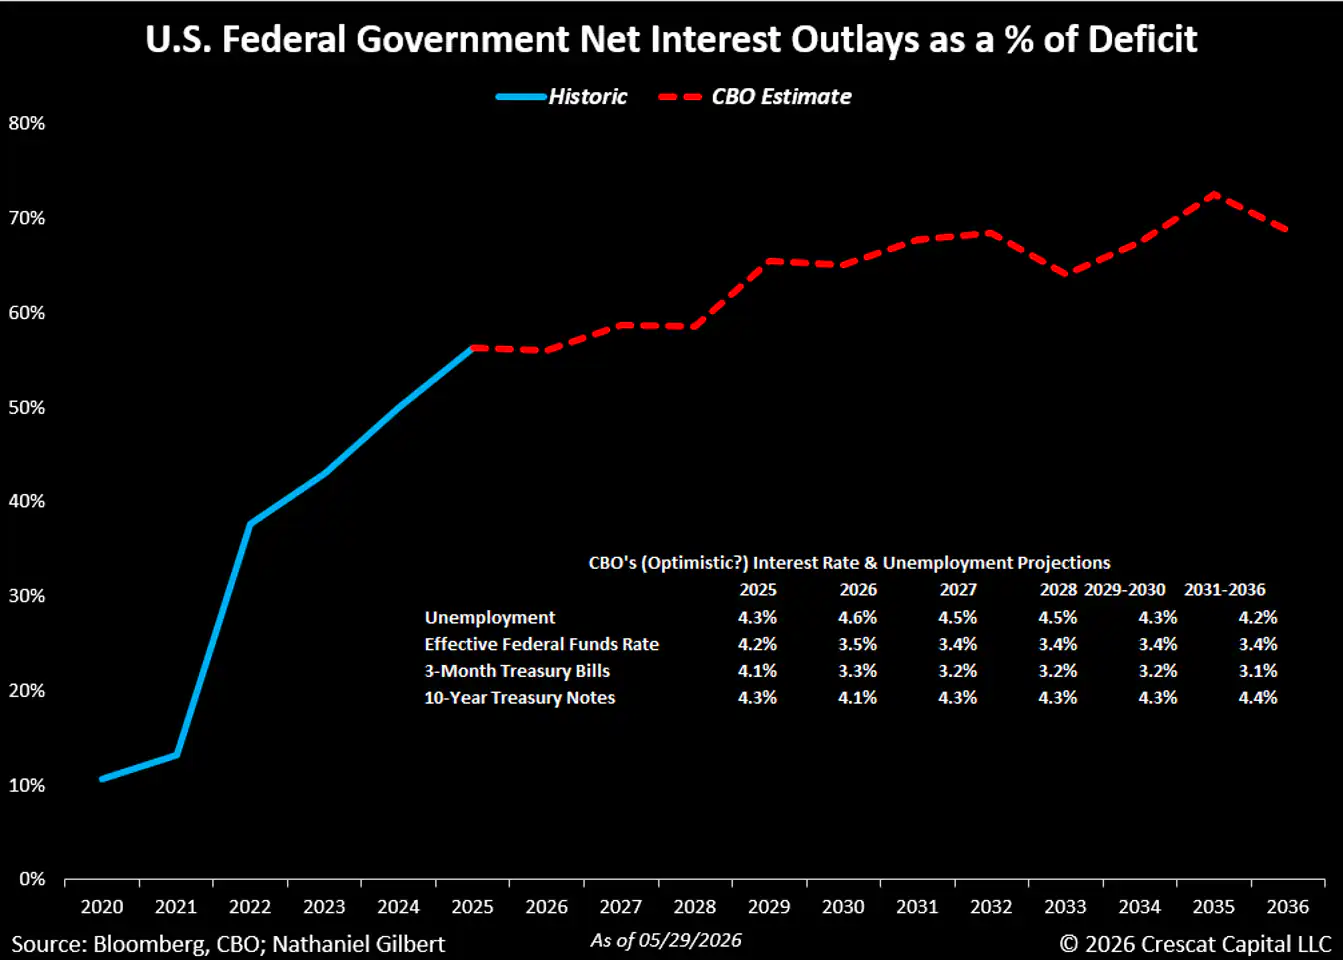
The United States could be entering a phase where borrowing is no longer mainly funding new policy choice, but rather increasingly financing the cost of previous borrowing. In other words, most new debt issuance is to finance existing debt. Based on the CBO estimates, net interest outlays will account for north of 60% of the Federal Budget Deficit in the 2030s. In our view, the projected interest rates the CBO uses to calculate net interest outlays are optimistic yet critical red lines that the government cannot afford to have breached at all costs. The CBO is projecting that by 2036, the annual budget deficit will be about 75% higher than in 2025. It assumes that yields on the 3-month Treasury Bill will consistently stay about 0.5% lower than current rates.
Given the government’s current debt levels, a minimal increase in interest rates could have huge effects as interest payments soar. If, for whatever reason, investors begin to demand higher yields to hold debt, the Treasury will have to refinance maturing debt at a higher rate, which in turn raises net interest outlays, which increases the deficit, which requires more borrowing. In our view, this has the potential to push the average interest rate on government debt above GDP growth, and combined with the high levels of debt, can lead to a debt spiral and ultimately a debt crisis.
Enter Fiscal Dominance – Debt is Only Manageable with Both Low Rates and High Inflation
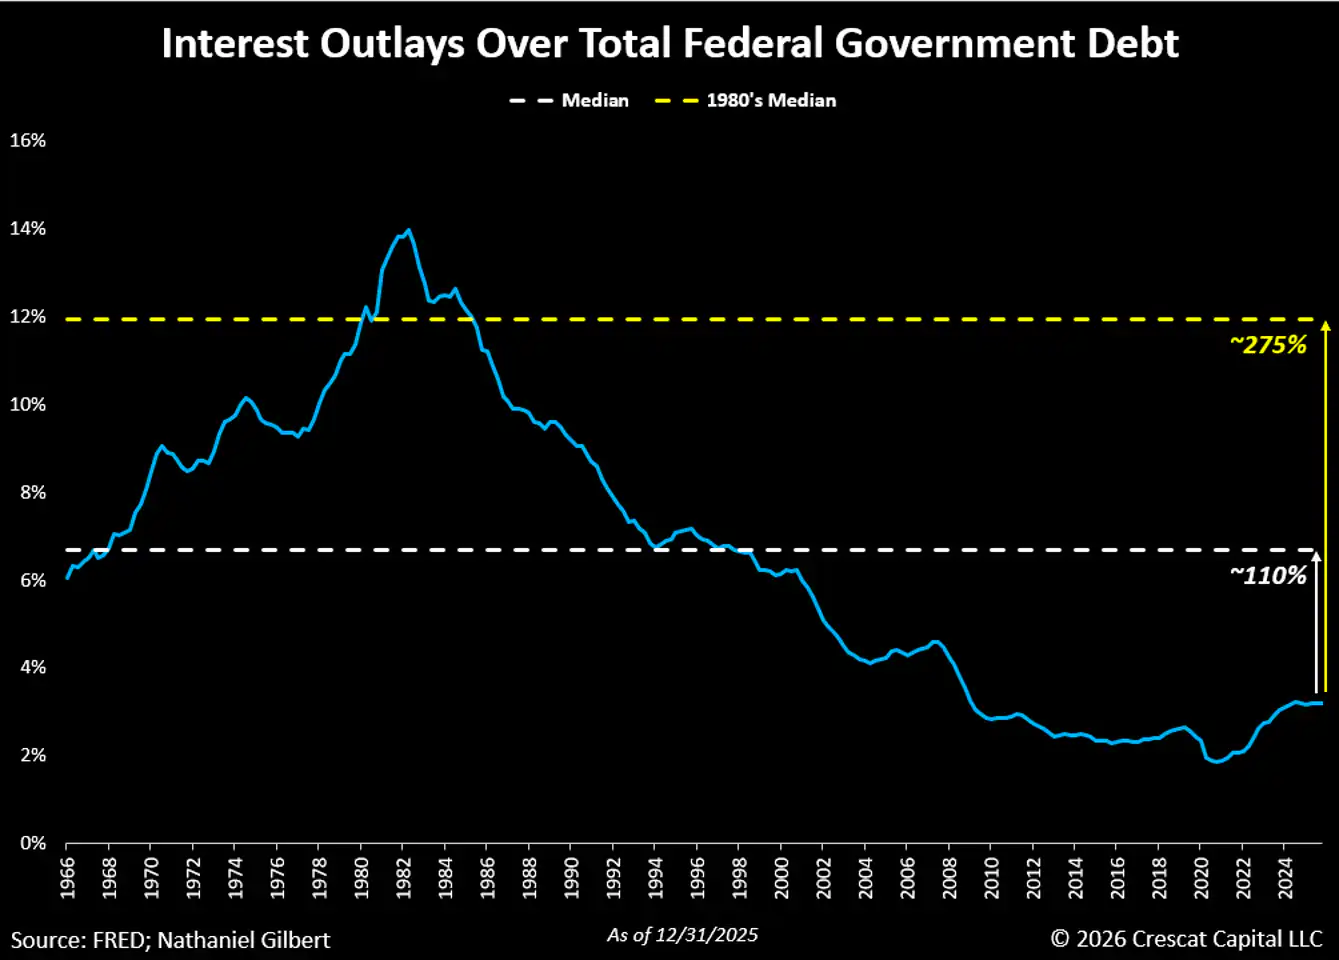
We believe the United States cannot afford the yields of the late 1970s through early 1990s. To illustrate this point, let’s conduct a quick thought experiment.
As of 12/31/2025, interest outlays reflect an effective average interest rate of about 3.2% on the total federal government debt. The median effective interest rate from 1966 through 2025 was approximately 6.7%, and the median interest rate in the 1980s was about 12%. If the current effective interest rate were at the longer-run median, the total deficit for 2025 would have increased by 60% to about $2,842 billion, which is more than total individual income taxes for 2025. If it were at the 1980s median, the total deficit for 2025 would have increased by 150% to about $4,444 billion, which is more than total individual income taxes plus payroll taxes for 2025.
The seemingly impossible challenge facing policy makers is how to avoid falling into the trap of more spending leading to bigger deficits leading to more borrowing leading to higher interest payments leading to a bigger deficit and more borrowing again. We believe the likely answer is a central bank regime shift to “fiscal dominance”.
Under this regime, the Federal Reserve’s objective of containing inflation takes a back seat to the Treasury’s budget financing needs. This shift would mark a decisive break from the low inflation regime that defined most of the last 40 years. For us, we think we are already one full wave and seven years into a new secular inflationary regime that could last at least another decade.
Monetary policy is no longer an inflation-fighting tool; it has evolved into a debt management tool. Interest rate suppression, yield curve control, and other forms of financial repression are likely to keep government borrowing costs artificially low and inflation high for the next decade.
Holding interest rates below the level required to curb aggregate demand and anchor inflation expectations transforms inflation into the adjustment mechanism. Policy makers can allow inflation to erode the real value of outstanding nominal government debt over time. The debt issue becomes more manageable not through traditional tax increases or spending cuts, but rather an inflation tax.
But such policies only work for the benefit of the real economy in the short run through “surprise inflation”. It is obvious that our government officials have continuously kicked the can down the road on solving the long-run fiscal imbalances. Renowned economist John Maynard Keynes of the Great Depression era has a famous quote that is prescient: “The long run is a misleading guide to current affairs. In the long run, we are all dead. ” In our view, it is crazy to us that so few are willing to foresee and prepare for the long-run inflationary implications of the current macro setup!
The Stock Market Today Represents a Terrible Hedge Against Future Rising Inflation
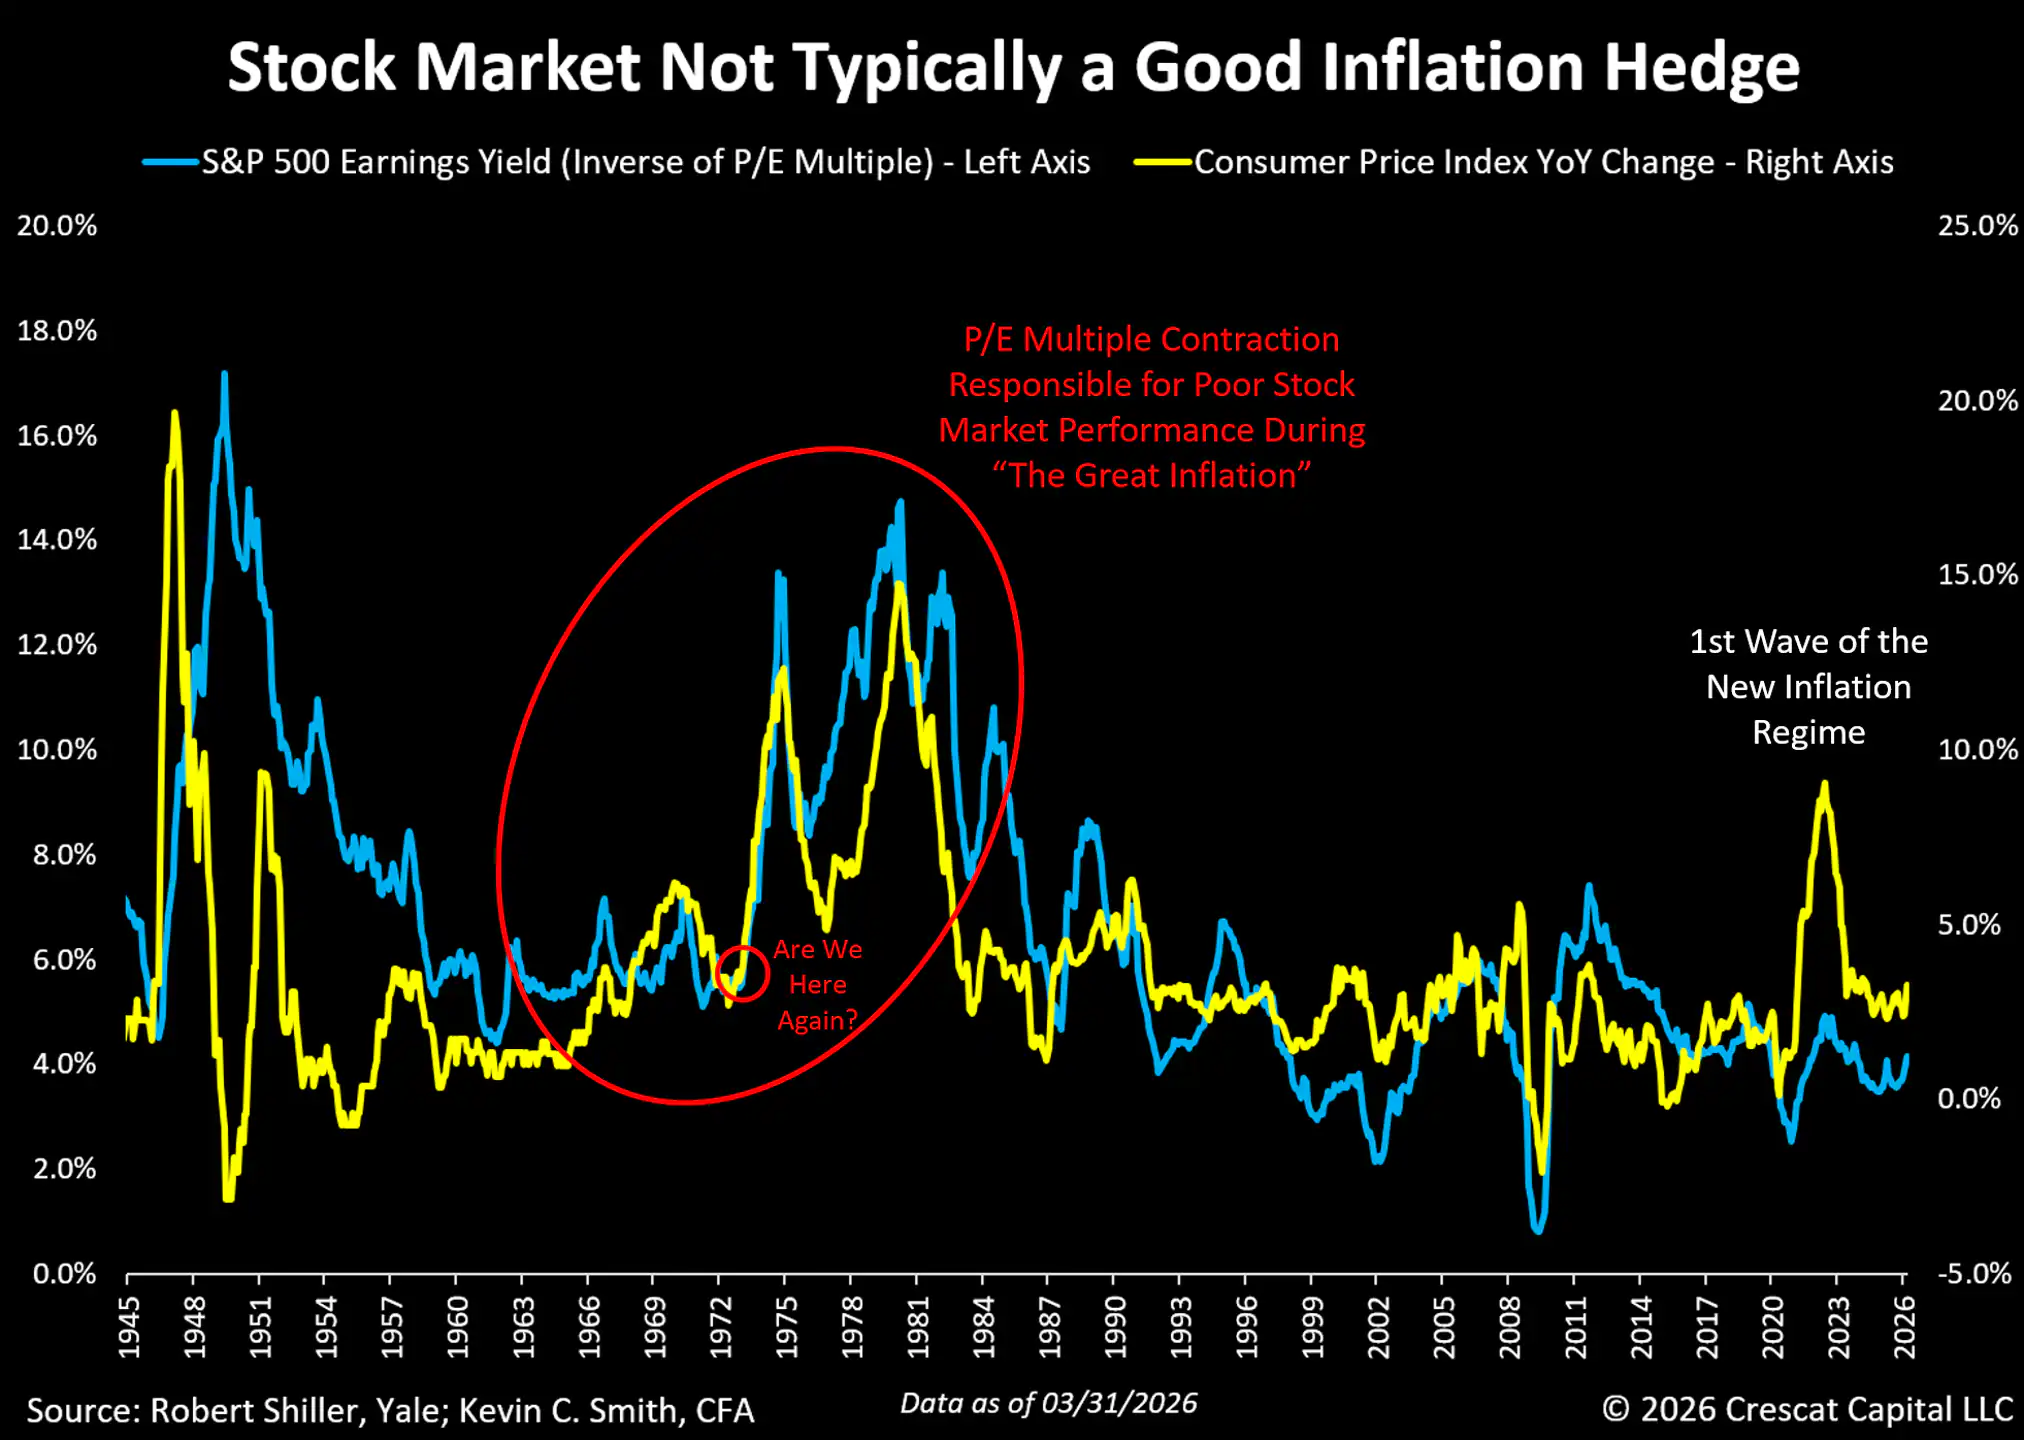
It is also crazy to us that so few are considering the next 10-year implications of real stock market returns in a rising inflation environment starting from today’s historically high valuation multiples. History clearly shows that the stock market’s P/E multiple at large shrinks during rising inflation to negatively impact both stocks’ nominal and real performance. We can see the strong positive correlation of the S&P 500 earnings yield (the inverse of its P/E multiple) and CPI inflation in the chart below. There is no greater proof that the stock market is a terrible hedge against inflation than during the period of “The Great Inflation”, especially from 1968 to 1980.
One Industry Group Can Be a Great Inflation Hedge
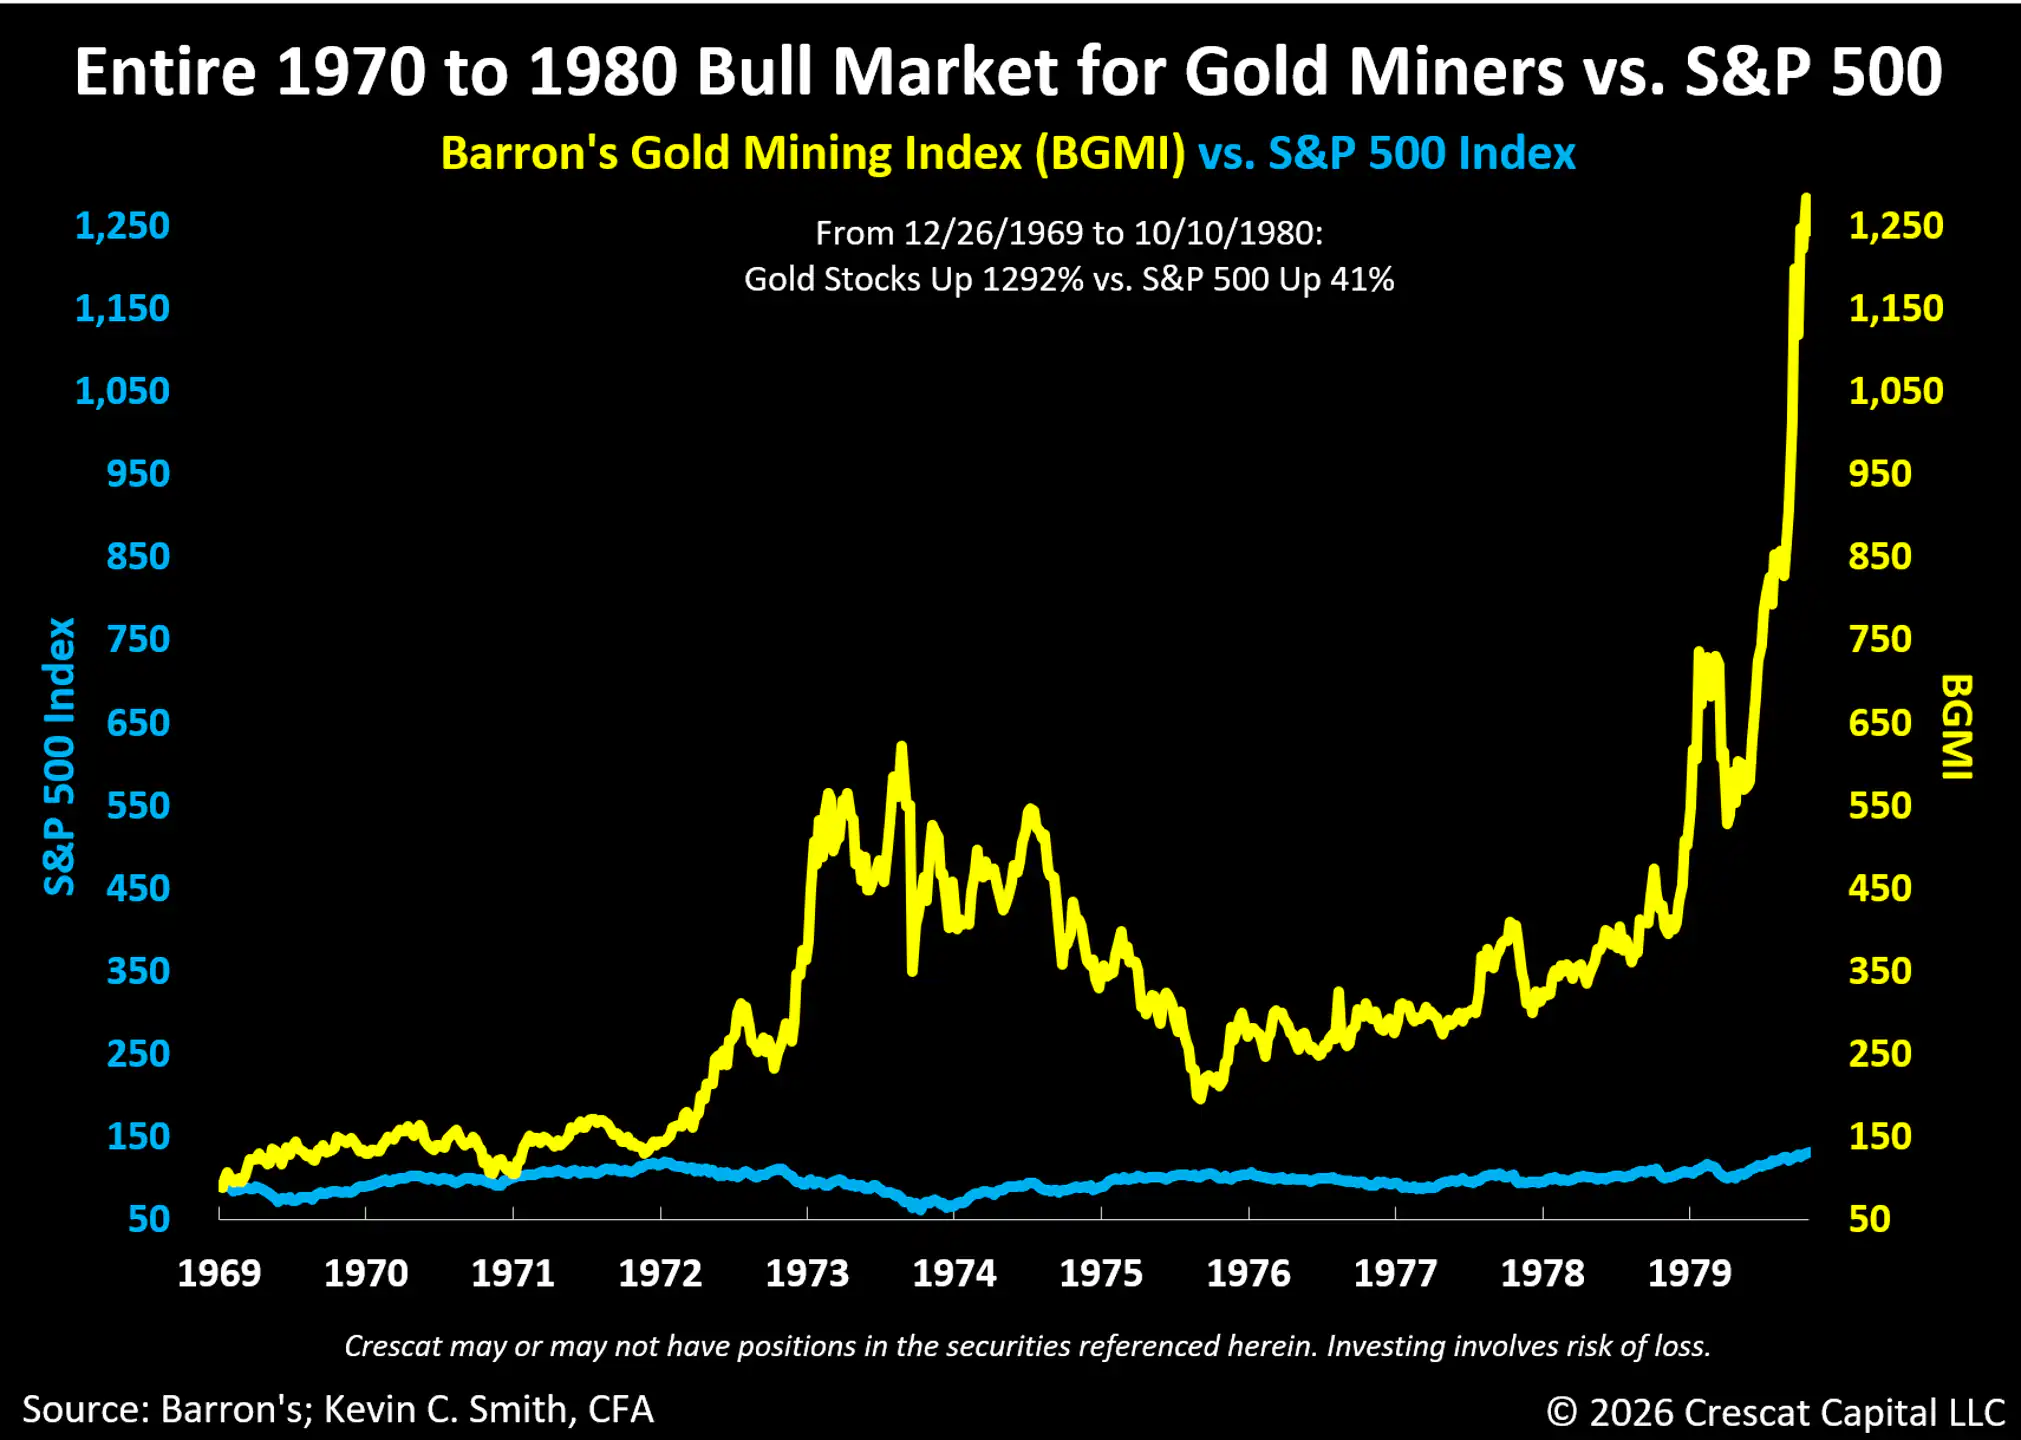
In our view, of all industries in the stock market, there is one that offers the greatest inflation protection and real growth opportunity in the stock market today for what we believe can be the entire decade ahead, especially starting from today’s low valuation levels and future high-growth opportunities relative to the stock market at large, and that is the precious and critical metals mining industry. For reference, look at how gold mining stocks outperformed the S&P 500 during “The Great Inflation. ”
SpaceX (SPACE) IPO Could Mark the Stock Market Top
After the manic stock market rally in May, the Buffett Indicator now sits at a new record 238% total US stock market cap to GDP, dwarfing the 2000 Internet bubble, the 1971 Nifty 50 mania, and the 1929 bubble.
As Michael Burry has recently pointed out, adjusted for inflation, the upcoming IPOs of just three companies, SpaceX, OpenAI (OPENAI), and Anthropic (ANTHRO), are expected to raise more than all 300 TMT (technology, media, and telecommunications) IPOs did in 2000.
At its expected $75+ billion raise and $2+ trillion valuation, SpaceX would be the largest IPO in history. OpenAI and Anthropic IPOs are expected to follow SpaceX this year with $60+ billion raises and $1+ trillion market caps.
As Burry also pointed out, AT&T Wireless (T), which raised $10.6B in its IPO in April 2000, was the largest IPO in history to that point. Unbeknownst to investors at the time, the Internet stock market bubble had just topped the month before in March of 2000. The Nasdaq (NDAQ) Composite would go on to fall 78% over the next 2.6 years. SpaceX is currently expected to price its IPO on June 11 and start trading on June 12, less than two weeks away.
In 2025, SpaceX generated $18B in sales and $6.6B in EBITDA (earnings before taxes, depreciation, and amortization) per its S-1 filing. Yet, at a $2 trillion post-IPO market cap, that is a multiple of 111 times sales and 303 times 2025 EBITDA. It is important to point out that, based on 2025 revenues and EBITDA, SpaceX’s expected price-to-sales multiple will exceed all 1256 US publicly traded companies with both sales and market caps over $1 billion and positive EBITDA today. And its expected price-to-EBITDA multiple will be in the top 1% of the same universe.
We believe we are in an unsustainable AI capex spending bubble that will also catalyze the market top due to imminent free cash flow destruction and ultimate overstatement and write-down of earnings across the hyperscalers. Amazon (AMZN), Alphabet (GOOGL), Microsoft (MSFT), Meta (META), and Oracle (ORCL) were formerly dominant, monopolistic large cap tech companies that have completely altered their long-term profitable business models to join the competitively disruptive AI race. Crescat’s Macro and Long/Short funds continue to maintain short positions with the goal of capitalizing on what we believe is an inevitable and possibly imminent stock market downturn.
Nine Representative Stocks in Crescat’s Activist Metals Portfolio
We encourage our current and prospective investors to learn more about these nine representative, low-valuation, high-potential growth metals’ exploration stocks across Crescat’s funds by going to our YouTube channel, our X feed, and our website to review our past commentaries and geologic and financial analyses of these companies. The criteria for inclusion in this list of companies are as follows: The largest holdings firmwide across our activist metals’ portfolio among three publicly listed exploration stocks from each primary metal target category (gold, silver, and copper). The company must have a bona fide discovery with tier-1 scale resource growth potential based on Crescat’s geologic estimates. Tier-1 scale means that the asset has the potential to become a producing mine that will ultimately generate at least 500 thousand ounces of profitable gold-equivalent metal per year over at least a 10-year mine life. We believe such companies are attractive acquisition candidates for a major mining company and allow for a self-sustaining mining company on its own merits.
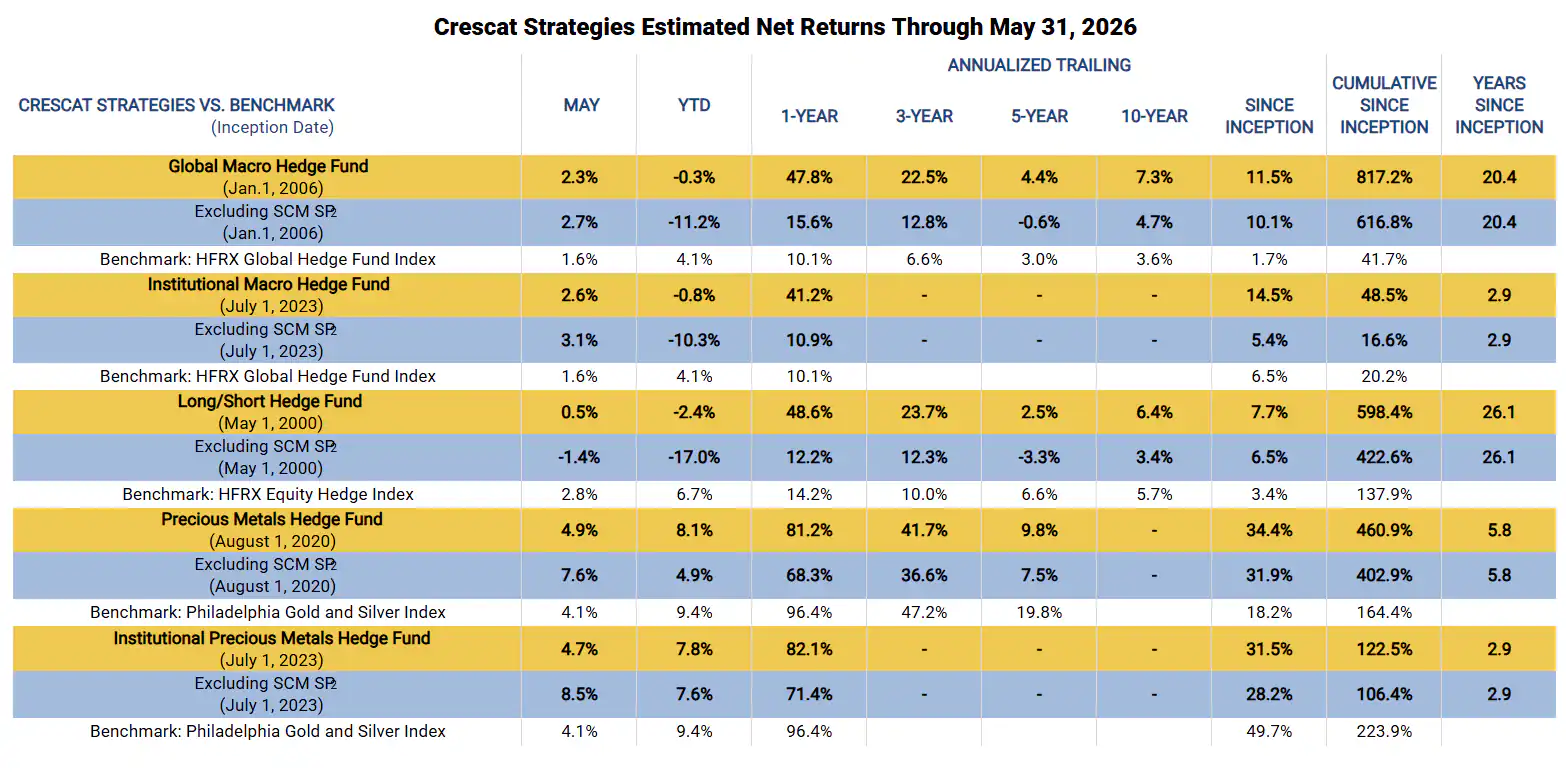
May Performance Estimates
Four of Crescat’s five funds delivered net gains in May and outperformed their benchmarks for both the full fund and ex-side pocket based on our preliminary estimates. Due to its relatively higher short exposure through US equity index put options, the long/short fund had a small loss ex-side pocket. Index puts also detracted from our two macro funds. Our two precious metals funds delivered significant outperformance in the month, driven by new drill-hole discoveries at Mogotes Metals (CA) and Barksdale Resources (BRKCF), as well as gains at San Cristobal Mining (SCMIF) (SCM), the funds’ largest position, which is also the sole position inside the side pocket. SCM is a private company and the 4th largest silver producer in the world. These positions also generated gains within our macro and long/short funds. Among our mining positions, Core Silver (CCOOF) was a notable detractor for the month across all funds.
Time to Get Positioned
The macro setup we have outlined is the environment in which precious metals miners have historically delivered their best returns: surging debt costs, large fiscal deficits, and what we believe is only the beginning of a second wave of secular inflation. With the stock market at record valuations and the potential SpaceX, OpenAI, and Anthropic IPOs that we believe could mark the top, we see a compelling case for being long precious metals miners with tier-1 scale discoveries and short the overvalued stock market. We think this is an outstanding time to add to or initiate a position across Crescat’s funds.
Sincerely,
Kevin C. Smith, CFA, Founder & CEO
Nathaniel Gilbert, Analyst
References
- 1 – Net returns reflect the performance of an investor who invested from inception and is eligible to participate in new issues and side pocket investments. Net returns reflect the reinvestment of dividends and earnings and the deduction of all expenses and fees.
- 2 – Performance figures presented Excluding SCM SP represent the fund’s net returns calculated without the impact of the San Cristobal Mining, Inc. side pocket that was designated on July 1st, 2024.
Editor’s Note: The summary bullets for this article were chosen by Seeking Alpha editors.
Editor’s Note: This article discusses one or more securities that do not trade on a major U.S. exchange. Please be aware of the risks associated with these stocks.