Cycle Lines Indicator: How to Master Market Timing with Systematic Trading
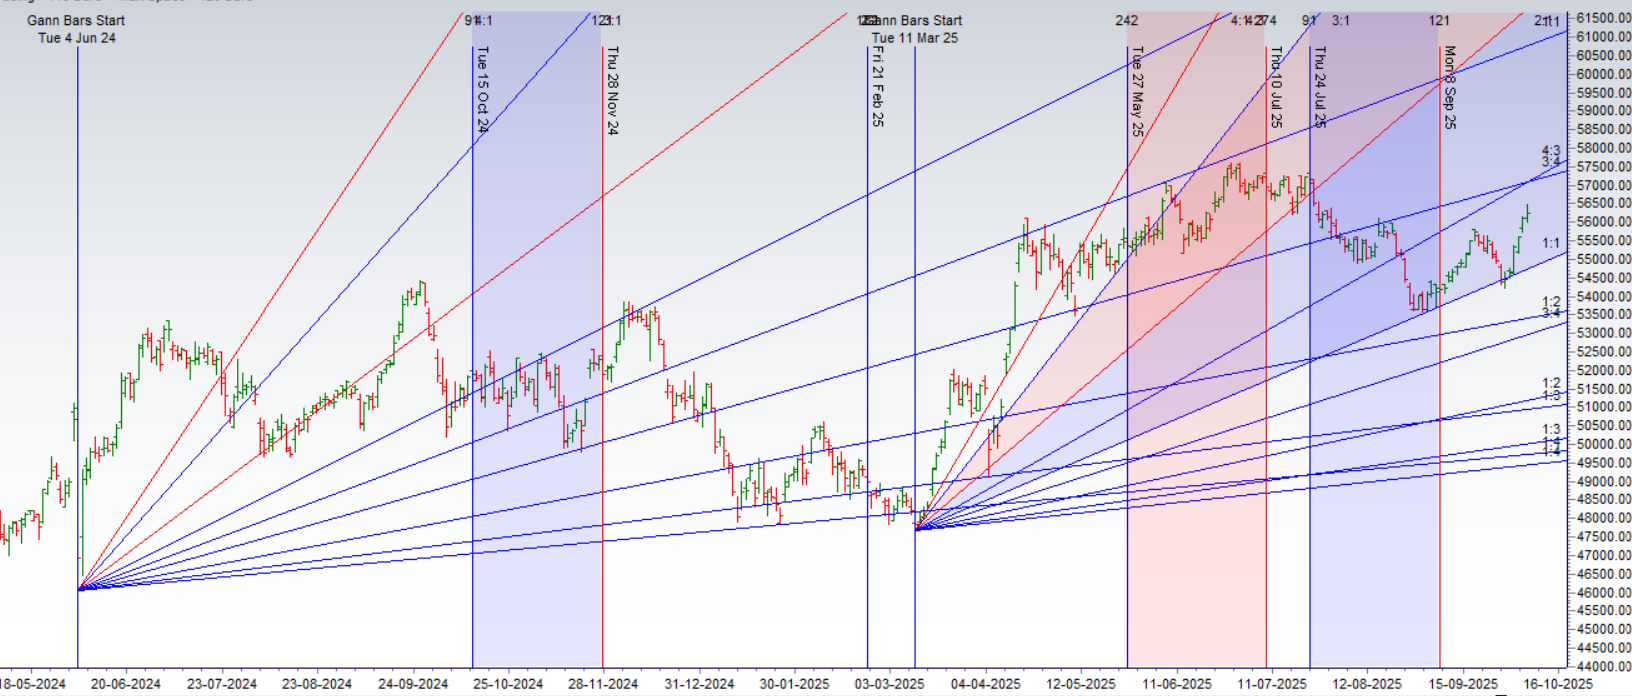
Cycle Lines operate by placing vertical markers at fixed time intervals on a price chart. These intervals may be daily, weekly, or even monthly, depending on the trader’s chosen strategy and market conditions. Traders then analyze price behavior components around these time markers to identify potential reversals, breakouts, or consolidations.
There are several key ways traders use Cycle Lines effectively:
- Identifying cyclical patterns by studying how prices behave near Cycle Lines to detect repeating patterns.
- Timing entries and visual exits by aligning trades with established cycle and trend-based turning points.
- Pairing with other indicators such as moving averages, RSI, or MACD to confirm potential trade setups.
Cycle Lines are different from traditional price-based indicators because they focus exclusively on time rather than price action. While moving averages smooth out price fluctuations to indicate trends, and MACD measures momentum shifts, Cycle Lines highlight potential time-based reversal points. This makes them especially valuable for traders who want to refine their timing in systematic trading strategies by integrating input parameters to enhance predictive accuracy.