View Your Watchlist With StockCharts CandleGlance
Viewing a watchlist in CandleGlance on StockCharts offers a quick, visual way to scan multiple stocks at once.
Instead of clicking through individual charts, CandleGlance displays your list in compact, side-by-side thumbnails, making it easier to spot trends, relative strength, and emerging setups.
Sorting by an indicator such as RSI prioritizes your list of stocks.
Contents
All free.
No subscription needed.
You don’t even need to log in with an account.
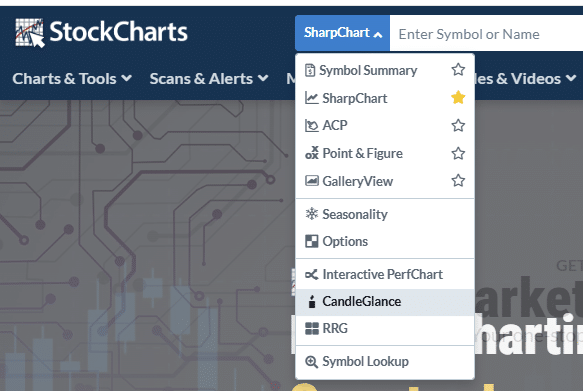
Step 1: Go to stockcharts.com
Step 2: Select “CandleGlance” in the search dropdown…
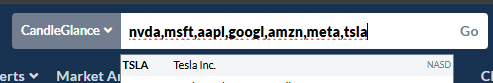
Step 3: Enter your ticker symbols separated by commas.
Max of 12 symbols.
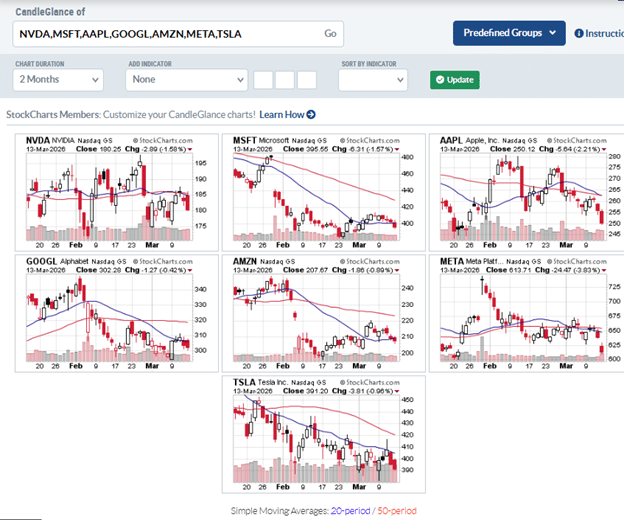
For this example, I have entered the Magnificent Seven stocks.
It can be all caps, or just lowercase, with or without a space after the comma.
No matter.
Stockcharts will figure it out.
Even if you don’t know the ticker symbol, you can type the name of the company (say “Coca Cola”) and it will display relevant symbols for you to choose.
Step 4: Click “Go” in the search.
The thumbnail charts show the daily chart across 2 months.
This can be changed to 6-month or 1-year periods, or even to point-and-figure charts.
The 20-day and the 50-day simple moving averages are drawn.
From the legend at the bottom of the page, the blue line is the 20-SMA and the red line is the 50-SMA.
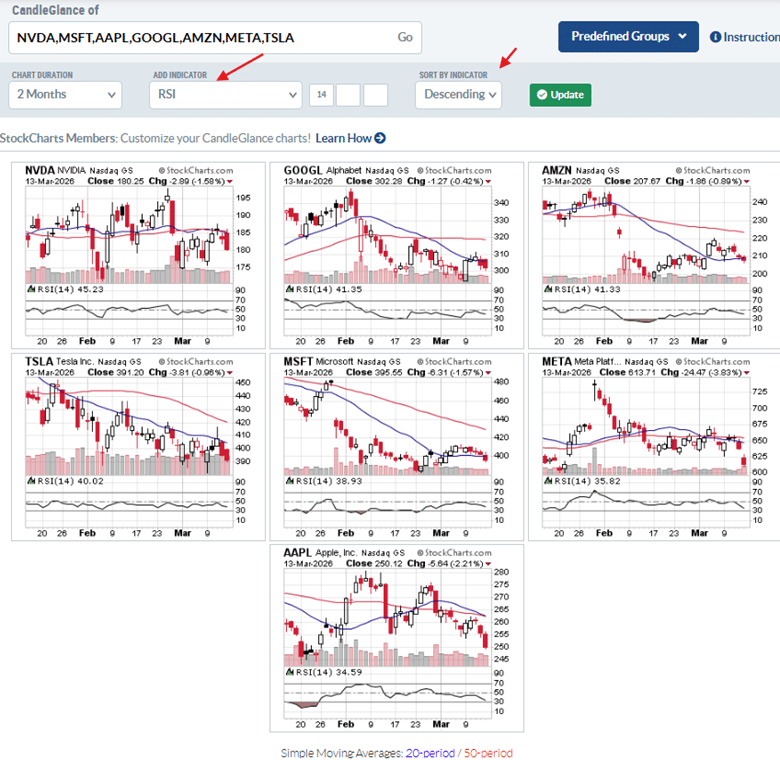
Step 5: Add the RSI indicator and sort in descending order.
Now the charts show an RSI panel at the bottom.
It is the 14-period RSI, the standard default setting.
But that can be changed if you prefer.
Sorting in descending order places the chart with the highest RSI value at the top.
Now we can easily see that over the last two months, Nvidia (NVDA) has been the best performing with the highest RSI at 45.
Apple (AAPL), with an RSI of 34, is underperforming the rest of the Mag 7 stocks.
Step 6: Bookmark the URL so that next time you don’t have to type all your symbols and reset the RSI settings.
We saw that none of the Mag 7 stocks have an RSI above 50 at the moment.
So maybe tech stocks are not the place to look right now.
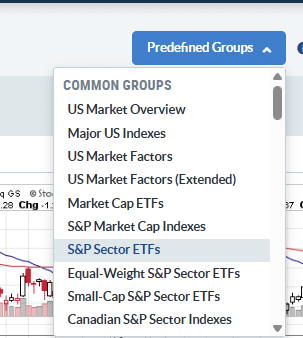
To see what sector is doing well right now, we can select S&P Sector ETFs from the Predefined Groups.
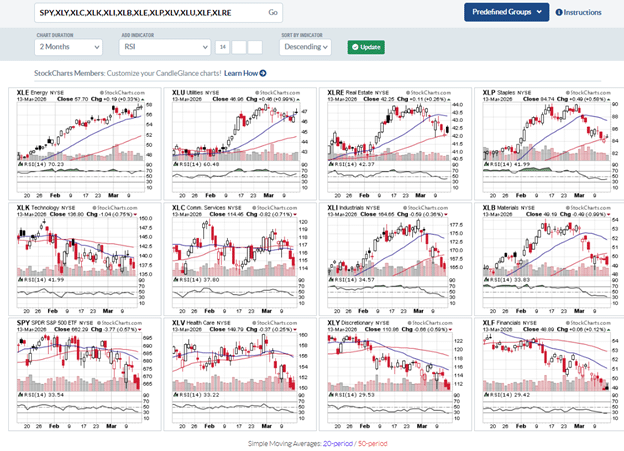
Again, you need to set RSI descending.
The display shows 11 sectors plus a chart of SPY, giving a total of 12 thumbnails.
Eight of these sectors are currently outperforming SPY based on their RSI rankings.
Notably, XLK and XLC – of which many of the Mag Seven stocks are in – sit near the middle of the list.
At the moment, XLE (energy) stands out as the strongest sector, supported by upward-sloping moving averages.
On the other hand, XLF (financials) is lagging, with its moving averages trending downward.
CandleGlance lets you see all this without even needing you to click the mouse.
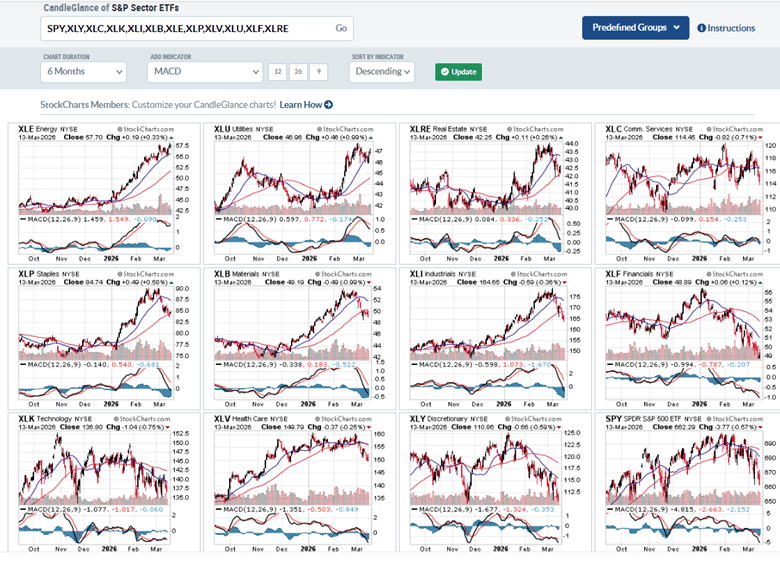
If RSI is not your thing, you can switch to another indicator.
For example, here is CandleGlance with MACD over 6 months…
While the list of indicators is limited, expand the indicator field to see which popular indicators are available.
By loading your stock into CandleGlance, the platform transforms a simple watchlist into an efficient chart-monitoring dashboard.
This is a tool not to be overlooked, because this feature is not found in many other platforms.
I use it all the time.
We hope you enjoyed this article on viewing your watchlist with StockCharts CandleGlance
If you have any questions, please send an email or leave a comment below.
Trade safe!
Disclaimer: The information above is for educational purposes only and should not be treated as investment advice. The strategy presented would not be suitable for investors who are not familiar with exchange traded options. Any readers interested in this strategy should do their own research and seek advice from a licensed financial adviser.
Source link