
Terra resumes operations after $5M security breach triggers Astroport token plunge

Bitcoin Difficulty Jumps 3% As Hashrate Slowly Recovers
On-chain data shows the Bitcoin mining difficulty has seen an increase in the latest adjustment, a consequence of the hashrate’s recovery.

Bitcoin Mining Difficulty Has Seen A Positive 3% Adjustment Recently

The “mining difficulty” refers to a feature built into the Bitcoin blockchain that controls how hard the miners would find it to mine on the Bitcoin network right now. The difficulty goes through periodic adjustments about every two weeks, which are entirely controlled by code and thus, are completely automatic.

When the network makes a positive difficulty adjustment, it means miners would find it harder to mine on the blockchain than in the past two weeks and as such, would have their pace slowed down.

On the other hand, BTC going through a negative adjustment implies miners would be able to mine through blocks on the network at a faster speed than in the last couple of weeks.

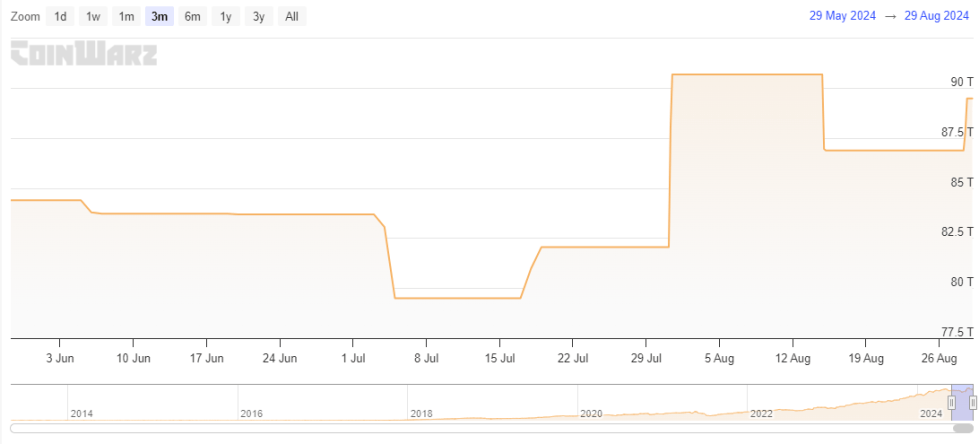
Now, here is a chart that shows how the last few adjustments changed Bitcoin’s difficulty:

Bitcoin Difficulty

As is visible in the above graph, the latest Bitcoin network adjustment has led to an increase in difficulty for the miners. More specifically, the metric has risen by 3% compared to the value at the end of the last adjustment.

To understand the reason behind this change (or any previous adjustment, for that matter), the goal behind the mining difficulty’s existence must be understood first.

A feature of the Bitcoin blockchain is that the cryptocurrency’s supply goes up whenever miners go through blocks and receive block subsidy as compensation for them.

Miners use computing power to solve puzzles that grant them the opportunity to add the next block to the chain, so when they increase their computing power, they become faster at their task, and hence, can produce blocks at a faster rate.

But as the production rate of the asset itself is tied to this task of the miners, leaving miners’ growth unchecked can lead to an explosion in the asset’s supply, which would adversely affect its price, due to how supply-demand dynamics tend to work out.

As a measure of keeping miners’ block production rate at a constant value, Satoshi, Bitcoin’s creator, decided to program in the concept of difficulty. Because of this feature, whenever miners increase their power, the network hits back at them with an increase of difficulty in the next adjustment.

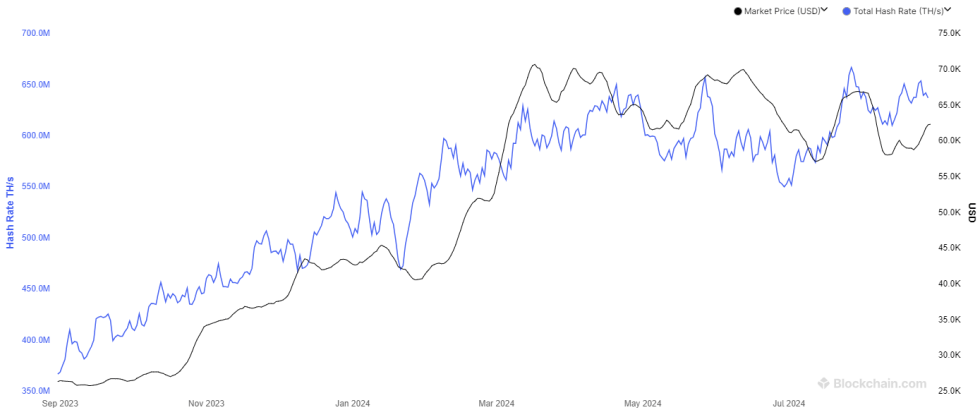
The total computing power of the miners is called the “hashrate.” Below is a chart that shows the trend in the 7-day average of this metric over the past year.

Bitcoin Mining Hashrate

As would be expected given the difficulty’s positive adjustment, the Bitcoin mining hashrate has been rising recently. Miners had earlier downsized their facilities, which had led to the metric plunging, but it appears that they have gradually started adding back mining rigs to their farms.

BTC Price

Bitcoin had plunged under the $60,000 mark yesterday, but the coin appears to have made recovery back above the level today.

Bitcoin Price Chart


Source link

Similar Posts

  • 如何识别和驾驭加密货币交易中的市场极端:井喷式顶部和抛售高潮 | BitMEX Blog

    在交易世界中,识别关键市场模式可以决定盈亏。这在加密货币这种波动性市场中尤为重要。 特别是,有些市场模式有助于预示市场极端,例如井喷式顶部和抛售高潮。它们是至关重要的指标,可以帮助指导人们在特定时间点的交易决策,例如何时买入或卖出。 本文深入探讨了每种模式,如何识别它们,以及有效交易这些指标的方法。 什么是井喷式顶部? 井喷式顶部——通常被认为是“最后的疯狂”——是发生在显著上升趋势结束时的一种现象。井喷式顶部指的是价格突然而急剧上涨之后,紧接着大幅下跌的情景。 你可以将其视为一个危险信号,试图警告你重新考虑你的头寸和交易策略。这种模式通常由投机性交易引起,可以预示资产价格的顶峰(通常先于市场下跌),因此对于交易者来说,识别它至关重要。 在期货交易中,使井喷式顶部特别有趣的是未平仓合约的行为。 井喷式顶部的特征: 价格急剧上涨: 在价格长期上涨之后,市场突然经历价格更加迅速的加速。 成交量激增: 这种急剧上涨伴随着交易量的显著增加,表明市场活动和参与度提高。 未平仓合约下降: 尽管成交量激增,但未平仓合约通常会出现明显下降。这表明交易者正在平仓,可能是在市场达到狂热水平时获利或减少敞口。 井喷式顶部示例 为了更好地描述这种情况,你可以在交易图表中找到井喷式顶部出现的示例,由红色箭头表示。 如何有效交易井喷式顶部 “入市时机先于把握市场时机”这句格言是正确的,因为试图把握市场时机(尤其是在使用杠杆时)很容易适得其反。 然而,成功交易井喷式顶部需要精心设计的策略和对市场动态的深入理解。 第一步是使用上述技术指标和图表模式识别井喷式顶部。一旦识别,交易者应通过趋势分析和交易量等其他工具寻找确认。 交易井喷式顶部的风险管理和注意事项 虽然交易井喷式顶部可以盈利,但它也有其自身的风险,因为它们通常是投机性交易的结果,这使得它们高度波动且不可预测。 这就是为什么在交易此类模式时,设置止损订单等风险管理策略至关重要。 此外,井喷式顶部可能受到一系列因素的影响,包括市场新闻和经济指标。因此,交易者应始终进行尽职调查,不要仅仅依赖图表模式。 什么是抛售高潮? 另一方面,抛售高潮发生在长期下跌趋势的末期。抛售高潮指的是价格急剧而迅速下跌,并伴随着大量的交易活动。 抛售高潮的特征: 价格急剧下跌: 在长期下跌趋势之后,价格突然进一步迅速下跌。 成交量巨大: 下跌伴随着交易量的显著增加,表明交易者的恐慌性抛售和投降。 迅速反弹: 在急剧下跌之后,随着恐慌消退和买盘兴趣回归,价格通常会迅速反弹。 抛售高潮示例 为了更好地描述这种情况,你可以在交易图表中找到抛售高潮出现的示例,如下所示。 如何有效交易抛售高潮 当市场瀑布式下跌时,在没有任何确认反转信号的情况下,重要的是不要试图“接住下跌的刀子”。 抛售高潮的普遍策略是等到“聪明钱”以扩大买入量进入市场并打印出高成交量看涨烛台。 第一步是使用指标和图表模式识别上述前提条件。特定看涨烛台模式的出现,尤其是在伴随高买入量时,可以确认上升趋势: 锤子线: 带有小实体和长下影线的烛台,表明可能反转。 吞噬模式: 看涨吞噬模式,其中一个小看跌烛台之后是一个完全吞噬前一个烛台的较大看涨烛台。 镊子底部: 两个或多个具有相似低价的烛台,表明可能反转。 蜻蜓Doji: 带有长下影线且没有上影线的烛台,表明可能看涨反转。 抛开理论,如果您希望在 BitMEX 上开始交易加密货币衍生品或现货,您可以在此处找到我们所有现有产品。有关交易的更多教育资源,请访问此页面。 想第一时间了解我们的新上架、产品发布、豪礼大放送等信息,我们邀请您加入我们的在线社区并与其他交易者联系。如需了解最新信息,您还可以关注我们的Twitter,或阅读我们的博客和网站公告。 Related Source link

  • US stocks rally as Trump delays EU tariffs, boosts trade optimism

    U.S. stocks soared Tuesday after President Donald Trump agreed to delay a proposed 50% tariff on European Union imports.  This pause eased investor concerns over an escalating trade war and paved the way for accelerated negotiations. The Dow Jones Industrial Average rose nearly 740 points while the S&P 500 climbed 2.05%. The tech-heavy Nasdaq Composite…

  • Australia Lays Groundwork for Tokenized Asset Markets After RBA Project – Decrypt

    In brief The RBA said tokenization is now a question of how, not if, as it outlined the next steps after its Project Acacia research program. Regulators, including the RBA, ASIC, and AUSTRAC, are now coordinating on legal and regulatory frameworks for tokenised assets and settlement systems. BTC Markets told Decrypt the move toward a…

  • Crypto API Trading Vs Manual Trading: A Detailed Comparision | ZebPay

    Crypto trading has substantially developed, providing investors with diverse strategies to manage the dynamic market. Let’s talk about some popular crypto trading strategies that people use: manual trading and API trading. Each method has its perks, and we’ll explore them here to help traders figure out what works best for their style and goals. Understanding…

  • Satoshi Nakamoto Still Holding $107,071,037,496 Worth of Bitcoin in Thousands of Wallets: Arkham

    Satoshi Nakamato, Bitcoin’s mysterious and pseudonymous creator, still holds more than $107 billion worth of BTC, according to the crypto data platform Arkham. Arkham recently added 22,000 Satoshi addresses to its database, listing total holdings of 1.096 million BTC. Arkham relies on Sergio Lerner’s Patoshi Pattern theory, which exploits three privacy-related flaws of v.01, an…

  • What Is Exit Liquidity? Meaning, Examples & How Not to Be It | BitMEX Blog

      What is Exit Liquidity? “Exit liquidity” is the pool of buyers a seller needs in order to unload their position without tanking the price. In crypto slang, being exit liquidity means you’re one of those late buyers—often lured in by hype—who unknowingly provides the demand that early holders use to sell into. How it…

Leave a Reply

Your email address will not be published. Required fields are marked *