Bitcoin ETFs outperform Ether ETFs as BlackRock’s IBIT leads peers – CoinJournal
Bitcoin ETF flows outperform Ether ETFs as BlackRock's IBIT leads peers
  • Bitcoin ETFs have attracted $5B net inflows while Ether ETFs have seen $500M net outflows.
  • BlackRock’s IBIT leads with over $224M in a single day, currently holding over 350,000 BTC.
  • Ether ETFs are struggling due to liquidity issues and Grayscale’s $2.5B outflows.

Recent trends in the cryptocurrency exchange-traded funds (ETF) market have highlighted a significant divergence in the performance of Bitcoin and Ether ETFs.

Comparing Bitcoin ETF Flow data to Ethereum ETF Flow data on Farside Investors, Ether spot ETFs have underwhelmed compared to their Bitcoin counterparts. Since their launch, Ether ETFs have experienced net outflows of approximately $500 million, a stark contrast to the $5 billion net inflows recorded by BTC ETFs during a similar period following their debut.

Several factors contribute to this disparity. To start with, Bitcoin’s “first mover advantage,” higher liquidity, and lack of staking opportunities in Ether ETFs have made Bitcoin more appealing to institutional investors.

Additionally, unexpected outflows from Grayscale’s Ethereum Trust (ETHE), amounting to $2.5 billion, far exceeding the bank’s initial $1 billion estimate, have further dampened Ether ETF performance. To counter these outflows, Grayscale introduced a mini-Ether ETF, but it has only managed to attract $200 million in inflows.

In contrast, BTC ETFs have shown resilience and robust performance with US-based BTC ETFs recording an impressive eight-day winning streak, with net inflows totalling $202 million led by BlackRock’s iShares Bitcoin Trust (IBIT).

On August 26 alone, IBIT attracted over $224 million in net inflows bringing its total Bitcoin holdings to over 350,000 BTC, solidifying its dominance in the market.

Bitcoin ETF flows outperform Ether ETFs as BlackRock's IBIT leads peers
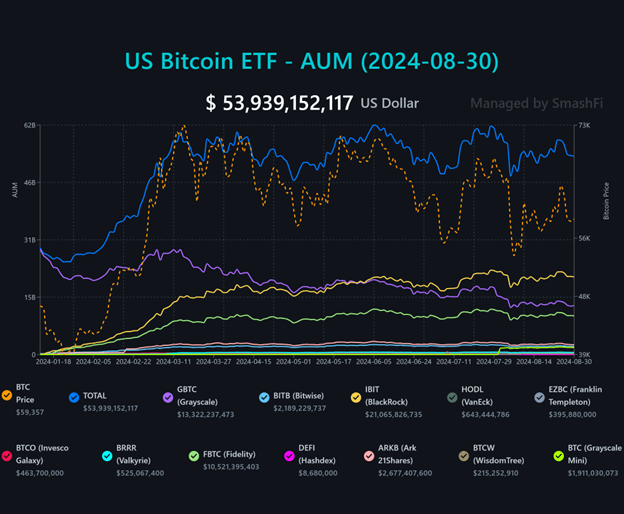
US Bitcoin ETF AUM, August January 18 – August 30, 2024|Source: Bitcoin ETF Fund Flows

Competing funds such as those managed by Franklin Templeton and WisdomTree also saw positive inflows, while others, including Fidelity, Bitwise, and VanEck, reported negative flows. Notably, Grayscale’s Bitcoin Trust (GBTC) saw a decline in redemptions over the past two weeks, indicating stabilization in the market.

As investor confidence in Bitcoin ETFs grows, asset managers are increasingly exploring combined ETFs that offer exposure to both Bitcoin and Ethereum, reflecting the evolving dynamics of the cryptocurrency investment landscape.


Source link

Similar Posts

  • Origin Summit Debuts in Seoul during KBW as Flagship Gathering on IP, AI, and the Next Era of Blockchain-enabled Real-World Assets

    Press Release Palo Alto, United States, August 26th, 2025, Chainwire First edition of the flagship institutional event, hosted by Story in collaboration with Blockworks and Korea’s largest finance media, Korea Economic Daily, convenes global leaders in AI, IP, and crypto to explore IP as the foundation of the $80T opportunity powering the AI economy. The…

  • Ethereum’s November Trading Frenzy: Spot Volume Hits $375B as ETFs Add $35B Punch

    ETH trading volumes surged from mid-year acceleration to a $599 billion peak. The trading activity of Ethereum (ETH) has remained high throughout 2025. Interestingly, CryptoQuant data now reveals that spot trading volume across exchanges reached $375 billion in November. Meanwhile, exchange-traded fund (ETF) volume climbed to nearly $35 billion. Institutional Money Pours In According…

  • 【分析】暗号資産市場は拡大しているのか? ドミナンスやビットコイン現物ETFなどのデータから変遷を紐解く – BitRss – Crypto World News

    暗号資産市場は拡大しているのか?  各種データから紐解く 暗号資産(仮想通貨)取引所「SBI VCトレード」の市場オペレーション部 ディーラー のHyeonjun Noh氏によるコラム/レポートを掲載します。今回のテーマは「【分析】暗号資産市場は拡大しているのか? 資産クラス規模、時価総額、ビットコインやステーブルコインのドミナンス、ETFのデータから、その変遷を紐解く」です。 今年は暗号資産市場にとって、ターニングポイントとなる年であると言っても過言ではありません。1月にはビットコイン現物ETFが、7月にはイーサリアム現物ETFが米国証券取引委員会(以下、SEC)によって承認され、取引が開始されました。また、4月に歴史上4度目となるビットコインの半減期を迎え、年内には米国の利下げが予想されるなど、暗号資産市場にとって重要なイベントが盛りだくさんです。 これらの出来事を通じ、暗号資産市場の規模は拡大してきたのではないかと予想する方も多いでしょう。果たして、実際には暗号資産市場はどのような変化を辿ってきたのでしょうか? 本稿では、上記の問いに対する解説として、ビットコインとステーブルコインを中心に暗号資産市場の構成を紐解いていきたいと思います。 暗号資産を区分する方法は、使用目的や独自レイヤーの有無など様々です。今回は、暗号資産市場におけるドミナンス(暗号資産市場全体の時価総額に対し、各銘柄がどれくらい占めているかを表す指標)を基準に考えていきたいと思います。 資産クラスとしての暗号資産市場の規模 ・資産別日次平均取引高(単位:1億ドル) World Gold Council、Coingecko提供のデータをもとにSBI VCトレード株式会社 市場オペレーション部作成 まず、暗号資産市場全体から触れていきます。上の図は、2023年度の暗号資産全体の平均日次取引高を、他の資産クラスの平均日次取引高と比較したグラフです。暗号資産全体の平均日次取引高は59.2億ドルであり、同期間においてDJIA(ダウ平均株価指数)とGerman Bunds(ドイツ国債)、U.S.Corporates(米国投資適格社債)を上回っています [*1] 。 暗号資産別時価総額推移(単位:10億ドル) この図は、2020年7月から今年7月まで約4年間の暗号資産市場全体の時価総額を表したグラフです。今年3月14日にビットコインが史上最高値(All Time High、以下ATH)を更新し、暗号資産市場は直近になって成長したかのように感じますが、実は市場が最も拡大していたのは、約3年前の2021年11月8日です。当時は時価総額が2.97兆ドルに達し、直近の最高(2024年3月13日)である2.76兆ドルを約2,100億ドル上回っていました。 しかし、グレーでハイライトされた2区間にかけて暗号資産市場の規模は急速に縮小し、2021年11月頃のATH時点と比べ、約3分の1の水準となりました。それから3年が経過した後赤色でハイライトされた区間で拡大が顕著となり、最盛期の水準に復帰、いわゆる「クリプト・ウィンター」からの脱却を果たしました。 ステーブルコインの時価総額推移とUSTC崩壊(単位:10億ドル) (緑色:USDT、青色:USDC、オレンジ色:BUSD、黄色:DAI、紫色:USDe、赤色:USDT)Glassnode、DeFi Liama提供のデータにてSBI VCトレード株式会社 市場オペレーション部作成 この図は主要ステーブルコインの時価総額推移です。ステーブルコイン全体の時価総額がATHを達成した前後、約2年前の2022年5月に「テラ・ルナショック」と呼ばれる、市場に衝撃を与える事件が発生しました。図中の赤いエリアを構成しているステーブルコイン「USTC」が崩壊したのです。 この事件の原因となったのは現在のTerraClassicUSD(以下USTC、当時はTerraUSD [UST] という呼称)でした。USTCは一時期ステーブルコイン全体の11.9%を占めていた当時話題の通貨であり、時価総額は186億ドル(約2.4兆円)に達していました(2022月5月9日ドル円レート130.73基準 [*2] ))。 ステーブルコインは、米国ドルなどの法定通貨や、金といった他資産に価格が連動(ペッグ)するように設計された暗号資産です。現在ではUSDTが第1位、USDCが第2位の時価総額を占めており、USDTとUSDCはともに法定通貨である米国ドルにペッグされています。 USTCはアルゴリズム型ステーブルコインであり、裏付け資産がペッグ対象の資産ではなくプログラミングされたアルゴリズム(USTCは、現在のLunaClassic [以下LUNC、当時はLUNA] のMint&Burnを通じてペッグを維持する設計)によって構成されていました。 その崩壊のきっかけとなったのが、2022年5月7日に起きた大手DEXからのUSTCの大量出金によるドルとの価格乖離(デペッグ)でした。信頼が揺らいだことにより5月7~8日にかけてはテラブロックチェーン上のDeFiプロトコルから預入金の約20%が流出。取り付け騒ぎの様な格好で急激なUSTCの売却(償還)が進み、USTCは1ドルからさらに大きくデペッグ [*3] 、アルゴリズムによってMint(発行)が繰り返されたLUNCもあっという間に価値を失いました。 テラ・ルナショックの更なる詳細については割愛 [*4] しますが、この事件により当時世界最大規模の暗号資産ヘッジファンドであったスリー・アローズ・キャピタル(3AC)をはじめ数多くの企業や投資家が甚大な被害に遭い、暗号資産市場の急激な縮小のきっかけとなりました。 ステーブルコインのドミナンス推移 (緑色:USDT、青色:USDC、オレンジ色:BUSD、黄色:DAI、紫色:USDe、赤色:USDT)(赤色四角:約30億ドルのBUSD焼却 黒色四角:PaxosのBUSD発行中止)Glassnode提供のデータにてSBI VCトレード株式会社 市場オペレーション部作成 ステーブルコインのドミナンスは、USDT、USDCが大半を占めていますが、近年ではDAIやUSDeなど、比較的新しいステーブルコインも登場してきました(この図で紫色と黄色に当たります)。 一方で、市場で存在感を失ったBinanceUSD(BUSD)などのステーブルコインもあります。…

  • Here’s Why The Dogecoin And Shiba Inu Price Crashed Over 10% | Bitcoinist.com

    Trusted Editorial content, reviewed by leading industry experts and seasoned editors. Ad Disclosure The Dogecoin and Shiba Inu prices have recorded significant losses this week, sparking a bearish sentiment towards the top meme coins. This price crash has come amid geopolitical tensions in the Middle East between Israel and Iran.  Why The Dogecoin And Shiba…

  • Expert Identifies Recent SEC Update That Could Create Upward Pressure on XRP Price

    While XRP struggles around the $3 mark, widely followed commentator Zach Rector has identified a new regulatory factor that could boost its price for a while. This comes amid recent developments concerning XRP exchange-traded funds (ETFs). For context, the U.S. SEC on Monday postponed its ruling on several proposed XRP ETFs, including the Grayscale XRP…

Leave a Reply

Your email address will not be published. Required fields are marked *