Can Bitcoin Seal its Best Weekly Close in Over Three Months?
Bitcoin (BTC) eyed $79,000 into Sunday’s weekly close as crypto markets continued to be guided by the US-Iran war.
Key points:
- Bitcoin circles a key weekly level into the weekly close, with the highest close in several months on the table.
- Analysis sees the mid-$80,000 zone and higher coming back into play.
- Liquidity grabs form the basis for caution among some traders.
BTC price nears highest weekly close in over three months
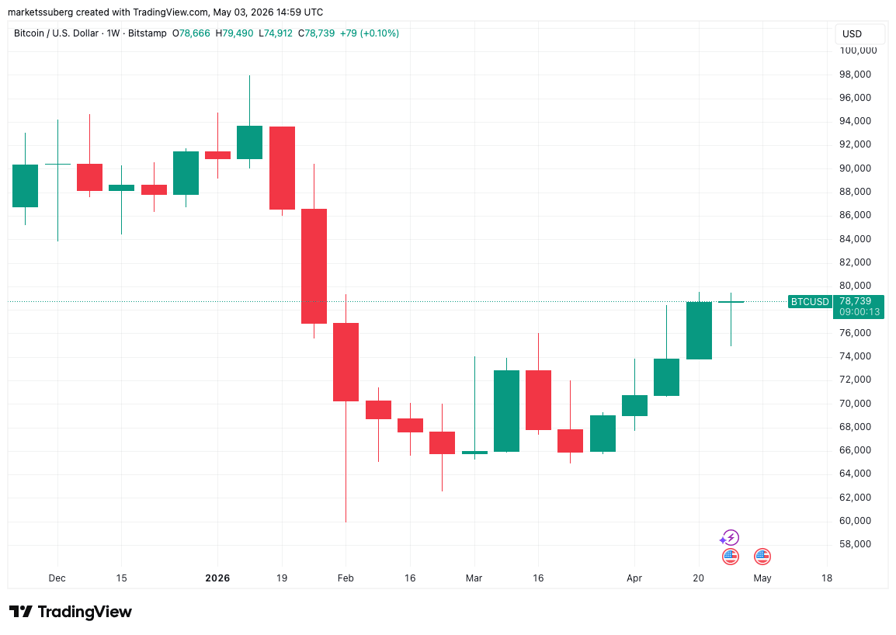
Data from TradingView showed BTC/USD attempting to hold higher after cancelling out losses from earlier in the week.
Finishing the week above $78,670 would deliver the pair’s highest weekly close since late January.
BTC/USD one-week chart. Source: Cointelegraph/TradingView
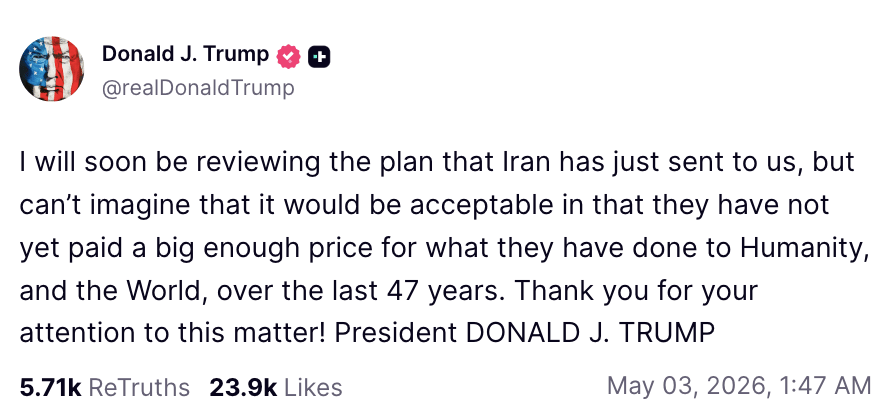
Friday delivered a boost to risk assets as hopes of a fresh peace agreement between the US and Iran accelerated. On Sunday, however, US President Donald Trump appeared skeptical of ratifying Iran’s latest peace proposals.
In a post on Truth Social, Trump wrote that he “can’t imagine that it would be acceptable.”
Source: Truth Social
Despite this, some crypto market commentators remained optimistic about the short-term outlook.
“Strong consolidation on $BTC , and Friday gave us a slight insight in what’s likely to come,” trader and analyst Michaël van de Poppe wrote on X.
Van de Poppe referenced Friday’s strong inflows to the US spot Bitcoin exchange-traded funds (ETFs), which totaled nearly $630 million.
“I don’t think this will slow down in the coming week and that’s probably why we’re seeing a relatively shallow consolidation taking place,” he continued.
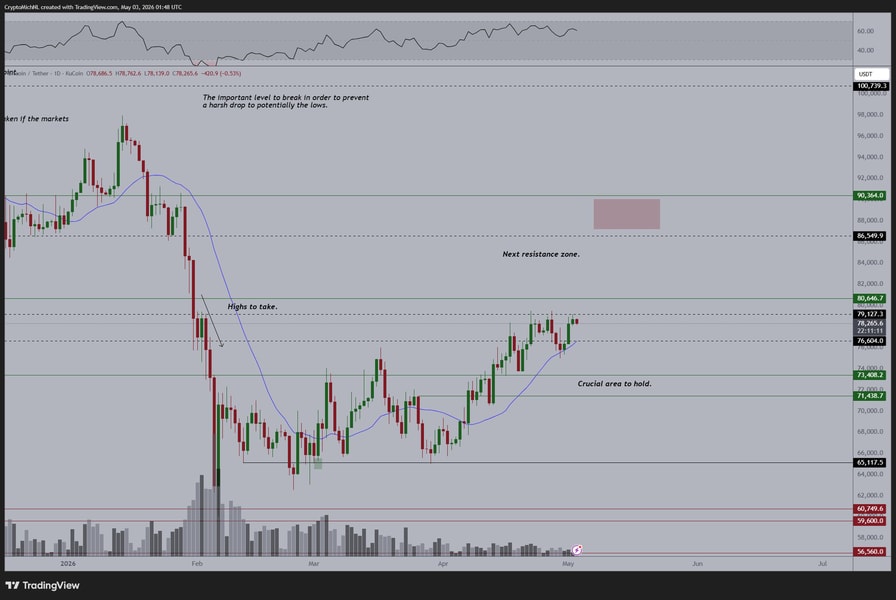
“The $79K area is a crucial zone. That needs to break. If this breaks, I’m assuming we’ll see more upwards momentum and I’ve got $86-88K as first resistance area and $92-94K as the crucial one.”
BTC/USDT one-day chart. Source: Michaël van de Poppe/X
Bitcoin traders warn of liquidity games
Caution was also visible, with traders watching for liquidity grabs to the upside before a subsequent price reversal.
Related: Here’s what happened in crypto today
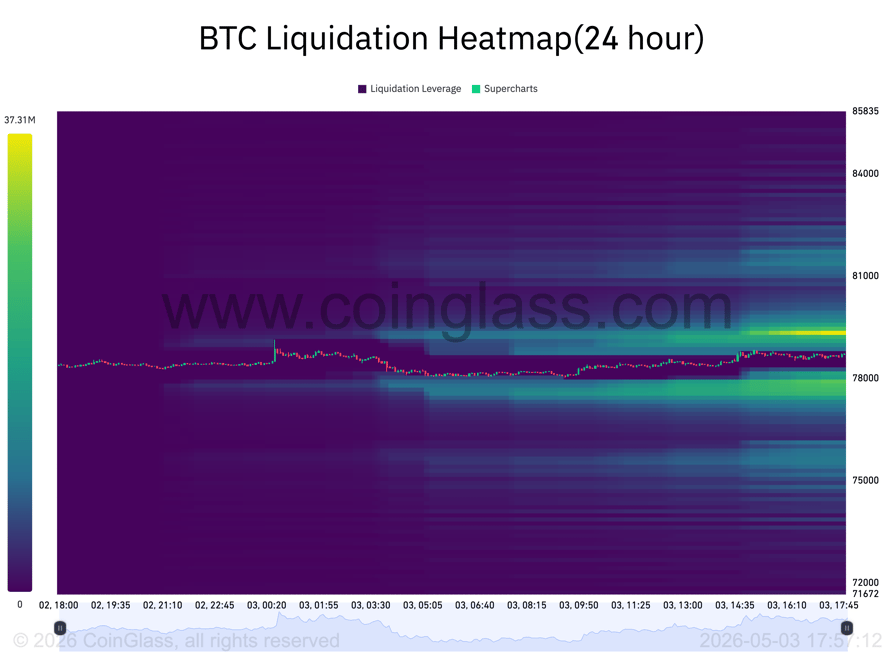
“Starting to see a build of liquidity form below, but a take of the high liquidity and using that to dump,” Crypto Tony commented on data from CoinGlass on the day.
BTC liquidation heatmap. Source: CoinGlass
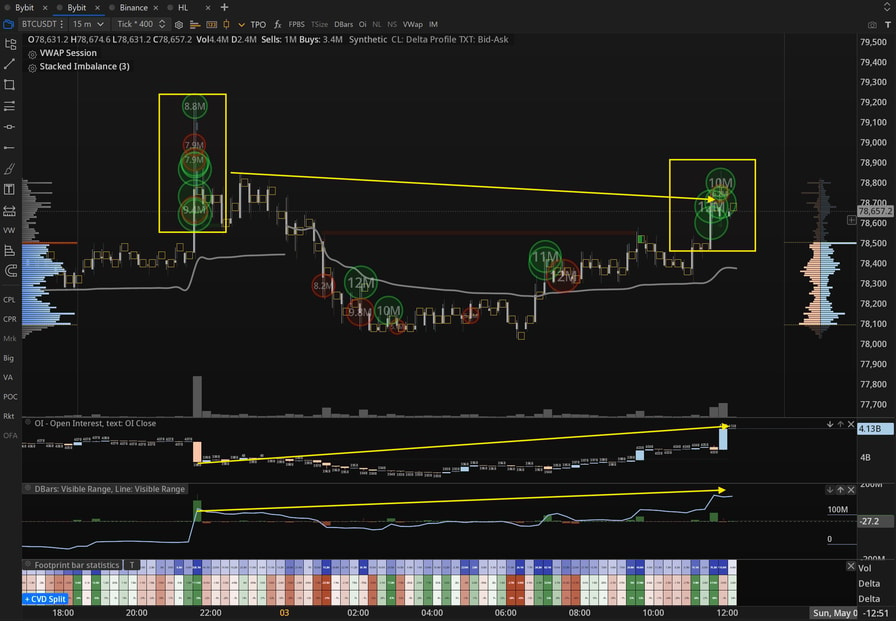
Trading account JDK Analysis described the liquidity setup as “typically bearish.”
“We can clearly see fresh longs opening into the highs, while price continues to show signs of absorption – unable to push meaningfully higher despite increasingly aggressive market buying for now,” it summarized in posts on X.
BTC/USDT 15-minute chart. Source: JDK Analysis/X
Source link