Bull Put Credit Spread Versus Iron Condor
Contents
Today, we’re going to compare the bull put credit spread with the iron condor.
The two strategies are considered relatively beginner-friendly because they involve defined-risk, high-probability trades.
That said, it’s usually best to start with the bull put credit spread first, because understanding how a single credit spread works is essential before you move on to combining spreads on both sides to create an iron condor.
The bull put credit spread is an omnidirectional strategy.
What does that mean?
It means that if the market moves in one direction (in this case, up), then there is nothing to do.
No adjustment is needed; you would just take the profit at your profit target.
If the price moves sideways, no adjustment is needed.
You only need to manage the trade if it goes in the wrong direction.
This is what makes omnidirectional strategies easy to manage for beginning options traders.
If you consider up, down, and sideways as three possible directions, then these trades profit in two of the three scenarios.
A bull put credit spread is to sell a put at a higher strike and buy a put at a lower strike.
Both put options are at the same expiration.
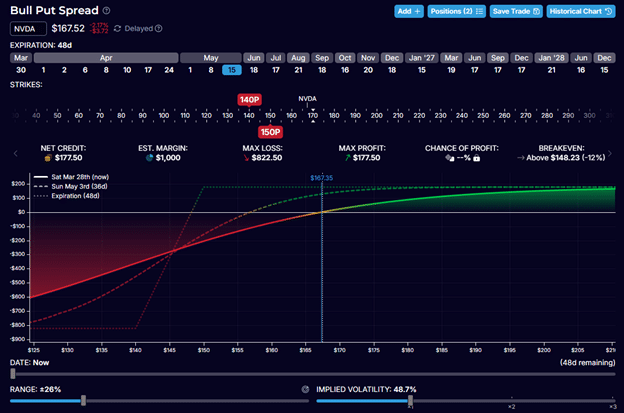
Here is an example of a bull put credit spread on Nvidia (NVDA).
Date: March 27, 2026
Price: NVDA @ $167.52
Sell one contract May 15 NVDA $150 put @ $4.10
Buy one contract May 15 NVDA $140 put @ $2.33
This means that in a single order, the trader is selling a put option with a strike price of $150 and buying a put option with a strike price of $140.
Both options expire on May 15th, about 49 days from the trade initiation.
The $ 150 strike put option is priced at $4.10 per share.
So selling one contract (which represents 100 shares) would give the trader a credit of $410.
The $ 140 put option at $2.33 per share will cost $233 to buy one contract.
Since…
$410 – $233 = $177
The trader got a net credit of $177 to initiate this one-lot bull put credit spread.
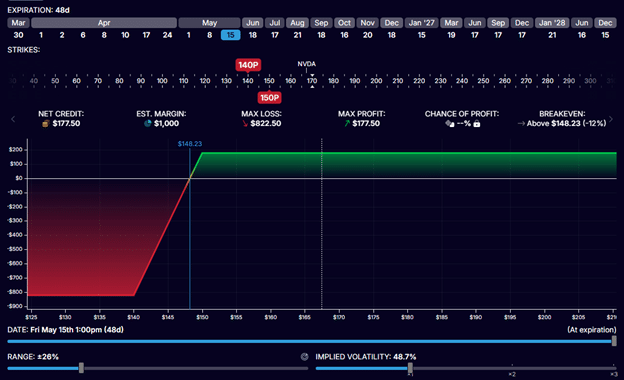
OptionStrat is an initiative-free learning tool that will render a payoff graph of the bull put spread…
The 150P below the price ribbon represents the $150-strike put that was sold.
This is the short strike.
The markers above the ribbon represent options that were bought.
Our 140-strike long put option is shown as 140P.
The curve line shows on the vertical axis what our P&L (profit and loss) would be if the price of the underlying (NVDA) moves up or down in price (the horizontal axis).
We see from the green area that we would profit when the price of NVDA goes up.
And we lose money (red area) when the price goes down.
This curve changes as time passes.
If we slide the Date slider “at expiration”, we see the expiration payoff graph…
If the price of NVDA is above $150 per share at expiration on May 15th, our profit would be $177.
We keep our entire credit received.
If the price of NVDA is below $140 at expiration, we have a max loss of $823.
Because this is the worst-case scenario that can possibly happen, this is a defined-risk strategy where our max risk is $823 even if NVDA goes to zero.
The blue vertical line marks our expiration breakeven, where the trade is profitable if NVDA is above $148.23 at expiration.
Most traders will not hold till expiration.
If their profit target is reached, they can close the trade early by buying back the short put and selling the long put in the same order.
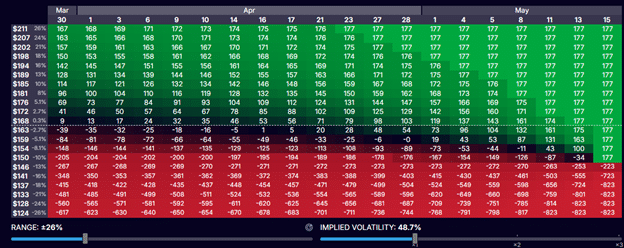
In table view form…
We can see in the red and green cells whether the trade would be profitable on a given date (top axis), depending on the price of NVDA stock (vertical axis on the left).
For example, if NVDA is down 10% to $151 per share on April 16th, it would be in the red by $177.
Since $177 is the maximum profit this trade can make, a $177 loss is the point at which the trader should monitor the position more closely or begin adjusting the trade.
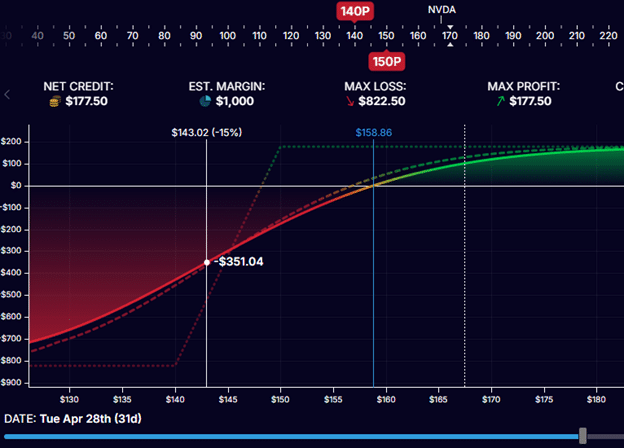
If NVDA keeps falling to $143 by April 28th, the loss in the trade would be $351.
Most credit spread traders will not let the trade get past this point since this represents a loss of “2X the initial credit”.
They would need to shut down the trade.
Otherwise, if NVDA continues to fall, losses can accumulate quickly, as it is on the steep slope of the curve…
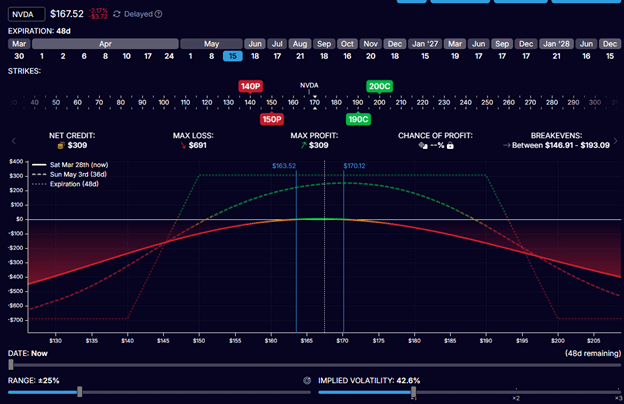
The iron condor is a bull put spread with a built-in hedge on the other side to mitigate such a downward price move.
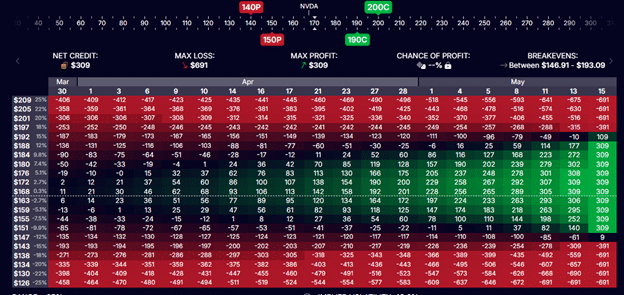
The iron condor is essentially two opposite credit spreads combined: A bull put spread and a bear call spread placed in a single order:
Date: March 27, 2026
Price: NVDA @ $167.52
Sell one contract May 15 NVDA $150 put @ $4.10
Buy one contract May 15 NVDA $140 put @ $2.33
Sell one contract May 15 NVDA $190 call @ $2.44
Buy one contract May 15 NVDA $200 call @ $1.12
Net Credit: $309
Note here that the max loss is $691, which is less than that of the bull put credit spread.
This also reduces the curvature of the P&L curve as the price declines.
At the current price of $167, the stock price is right in the middle of the structure where the curve is flat (horizontal).
This type of strategy is known as non-directional, or delta-neutral, of the three possibilities—up, down, or sideways—the iron condor works best when the price moves sideways.
These strategies suit traders who do not have a directional bias about whether the underlying will go up or down.
However, because of this structure, the trader must monitor the position in both directions.
The stock price must remain within a tighter range to be profitable.
This is better visualized in table form, where there are fewer green cells than the bull put credit spread.
The iron condor received a larger credit of $309 than the bull put credit spread.
It risked $691 to make $309, giving it a risk-to-reward of 2.2.
The bull put credit spread risked $823 to make $177, giving it a less favorable risk-to-reward ratio of 4.6.
The trade-off is that a less favorable risk-to-reward ratio means a higher probability of profit, as evidenced by more green cells in the table.
Bull Put Credit Spread:
- Wins in 2 of 3 market directions
- Higher risk if wrong (no opposing hedge)
- Requires management only on one side
Iron Condor:
- Wins only if price stays within a range
- Lower risk when wrong (built-in opposing spread acts as a hedge)
- Requires management on both sides
In a sense, if you assume the market has an equal one-third chance of moving in each of the three directions, the bull put credit spread actually carries a higher probability of profit, because two out of the three directional outcomes are favorable.
However, if the market moves in the wrong direction for a bull put credit spread, then the potential loss can be larger than that of an equivalent iron condor.
This is because the iron condor already has an opposing spread (the bear call spread) that acts as a built-in hedge, reducing overall risk on both sides.
Start with the bull put credit spread.
Once the trader is comfortable managing a single credit spread, they can progress to the iron condor, which requires managing both spreads.
We hope you enjoyed this article comparing bull credit spreads and iron condors.
If you have any questions, please send an email or leave a comment below.
Trade safe!
Disclaimer: The information above is for educational purposes only and should not be treated as investment advice. The strategy presented would not be suitable for investors who are not familiar with exchange traded options. Any readers interested in this strategy should do their own research and seek advice from a licensed financial adviser.

Source link