Chainlink Price Prediction: Link is Approaching $9.40 With Weak Bollinger Bands and MACD Signal Trend

Chainlink Price Prediction: Link is Approaching $9.40 With Weak Bollinger Bands and MACD Signal Trend – Brave New Coin


Chainlink has been trading in a fluctuating session, dropping off its initial highs and resting close to the $9.40 mark at the time of writing.

Price action reflects a downward trend throughout the day, with the sellers seizing power after trying to hold over $9.70.

The chart represents an evident change in short-term sentiment; the asset was unable to hold at higher positions and was drifting down into a zone of consolidation. The traders are now concentrating on technical indicators that reflect declining momentum and low upside potential in the short term.

CoinMarketCap Data Shows Sharp Intraday Reversal

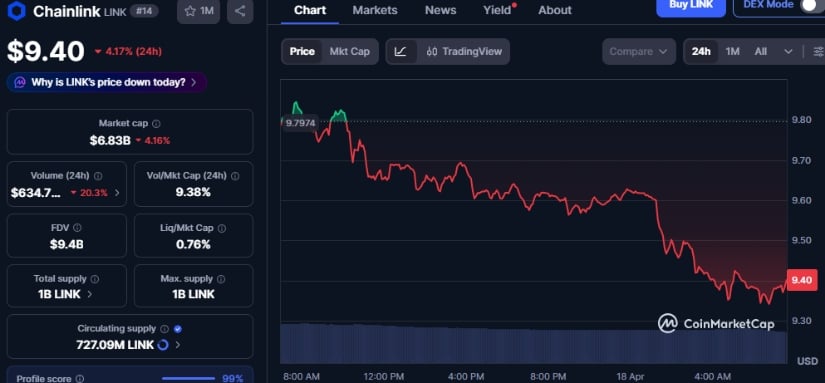
According to data, LINK has been trading around $9.40 following a drop of over 4% in the session. The price began the day in the vicinity of $9.70 to $9.80 and oscillated, and then went into a controlled downward trend.

CoinMarketCap Data Shows Sharp Intraday Reversal

The selling action on CoinMarketCap escalated in late trading sessions and pushed the price to the range of $9.30 before a slight recovery. The market capitalization is nearly at the mark of $6.83 billion, and the trading volume exceeded 600 million, which indicates an active market throughout the fall.

The price structure indicates the presence of uniform low highs throughout the session, which is a confirmation of the sustained selling pressure. Buyers tried to stabilize the market between $9.30 and $9.40, but recovery was still low at the time of writing.

Narrow Range Recovery is Confirmed by Market Data

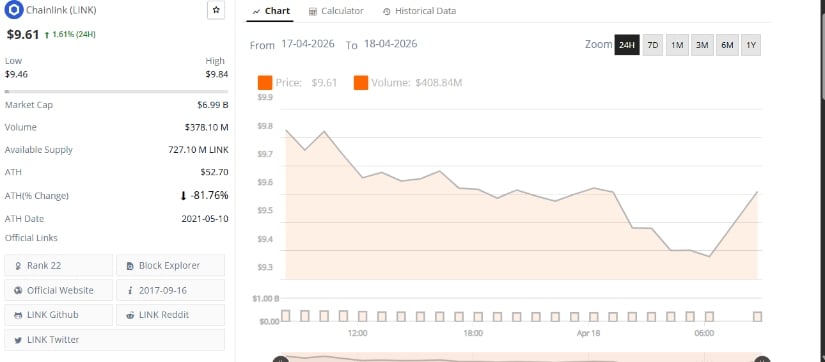
Other statistics provided by market data indicate that LINK is trading at $9.61 and gaining $1.61 per day in another trading session. This asset experienced a contained trading range of about $9.84 as the highest and $9.46 as the lowest, despite the volatility earlier.

Narrow Range Recovery is Confirmed by Market Data

The market cap from BraveNewCoin data is around $6.99 billion, and the volume is approximately $378 million. The circulating supply is maintained at about 727.10 million LINK, and this leaves the overall structure of supply unchanged.

Although this data experienced a short-term recovery, the price is still significantly lower than the historical high of $52.70 in 2021. The gap indicates that a wider market structure still indicates a long-term correction period.

Technicals Show Weak Momentum Near Key Bands

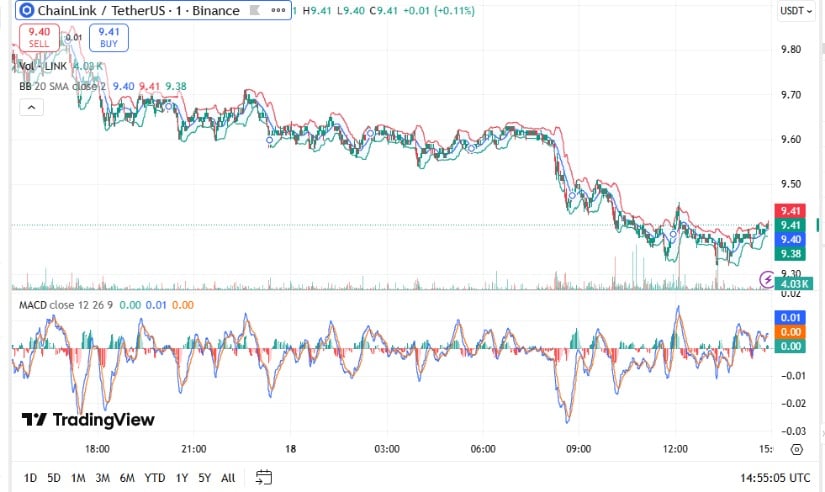
According to technical data, LINK is trading at the middle to lower part of the Bollinger Bands at the time of writing, and the price is around $9.38-9.41. Its upper band is near the $9.70 zone, while its lower band support is near $9.30.

Price recently hit the lower band in the sell-off, followed by a slight bounce, which is a sign of a short-term response from buyers. Nonetheless, the inability to revert to the upper band indicates that the strength of the bulls is not very robust.

Technicals Show Weak Momentum Near Key Bands

The MACD indicator from TradingView demonstrates numbers near the zero line, whereby the signal and MACD lines shift sideways. This structure indicates a weak momentum and the absence of a direction of the trend. The bars in the histogram are minimal, thus validating the fact that there is less strength in selling and buying pressure.

Volume trends reveal spikes as the drop was taking place and a decrease in activity when the price stabilized. This action is usually an indication that aggressive selling is decelerating, although it does not yet indicate a turnaround.


Source link

Similar Posts

  • U.S. Senate Cancels Vote on Caroline Crenshaw’s SEC Renomination, Ending Her Term

    KeyTakeaways: Senate cancels vote on Crenshaw’s renomination, ending her SEC tenure.   Crenshaw’s strict stance on crypto regulation sparks industry pushback.   SEC’s future may shift with upcoming departures and Trump’s crypto-friendly nominee. The U.S. Senate has officially canceled a scheduled vote on the renomination of Securities and Exchange Commission (SEC) Commissioner Caroline Crenshaw. 🚨BREAKING: A Senate…

  • Crypto Market Prediction: Bitcoin (BTC) to Rocket to $130,000? Shiba Inu (SHIB) Hits $0.000012 Breakout, XRP Breaks 5 Resistances in 1 Move – U.Today

    Bitcoin, Shiba Inu and XRP are all showing bullish momentum: BTC has reclaimed key EMAs and targets $125,000-$130,000 if it holds above support; SHIB has broken $0.000012 with volume but must maintain strength to avoid retracing; and XRP has reset its outlook by clearing all major EMAs with resistance ahead at $3.00-$3.20.   Bitcoin is back…

  • Newly Released Meme Coins to Add to Your Portfolio, September 22 – Vista Dog, Early Risers, Mega Dice

    Join Our Telegram channel to stay up to date on breaking news coverage Investors expect meme coin values to continue soaring. The recent surge in the price of newly released meme coins, driven by growing interest, has sparked predictions of a new era for meme tokens. This article provides investors with insights into profitable meme…

  • 第二部分:三角形的作用 | BitMEX Blog

    本文将深入探讨三角延续模式,以及它们的角度如何帮助您将交易提升到新的水平。它延续了之前对图表模式及其不同类型(旗形、尖旗形和楔形)基础知识的探讨。 当价格的最高点和最低点逐渐收敛形成三角形图案时,就会观察到三角形模式。 什么是三角模式? 当价格的最高点和最低点逐渐收敛形成三角形图案时,就会观察到三角形模式。 三角形模式可分为三大类:上升三角形、下降三角形和对称三角形。 什么是上升三角形模式? 上升三角形是交易中的看涨模式。它由一条水平阻力线和一条上升的下趋势线组成,形成三角形形状。 上升三角形模式的指标有哪些? **趋势线:**上升三角形由两条趋势线组成。顶部趋势线是水平的,连接摆动高点,底部趋势线是垂直的,连接更高的低点。 **收敛线:**随着模式的进展,两条趋势线的收敛形成三角形形状。这表明买盘动能增加,卖方积极围绕支撑位交易。 **成交量:**通常,随着价格接近顶点(两条趋势线的交点),成交量趋于下降。成交量上升的突破被认为比成交量低的突破更重要。 如何确认上升三角形模式? 突破确认:交易者通常在价格突破上升趋势线时寻求上升三角形模式的确认。突破表明卖压已解除,可能引发上涨走势。 成交量确认:为了使突破被视为有效,与模式盘整阶段的成交量相比,应观察到成交量显著增加。 什么是下降三角形模式? 下降三角形表明价格在突破前很可能发生盘整。 下降三角形模式是最常见的看跌延续模式之一。它由一系列较低的高点(价格从未突破下降阻力线)和一系列水平支撑线(连接相对相等的一系列低点)组成。 该模式表明看跌趋势可能延续,因为卖压依然存在,买方难以推动价格上涨。 下降三角形模式的指标有哪些? 趋势线:下降三角形的特征是两条趋势线在顶部连接(较低的高点),在底部连接(水平或较低的低点)。这表明顶部有下降阻力线,底部有明确的支撑位。 收敛趋势线:水平支撑线和下降阻力线相交,形成三角形形状。突破通常发生在接近交点时。 成交量:随着价格接近三角形的最右角,交易量下降,并在突破时突然飙升。 如何确认下降三角形模式: 突破确认:当图表突破水平支撑线时,就会发生突破。突破然后通过价格向下移动来测试明确的支撑位。 成交量确认:伴随交易量增加的突破确认了该模式,并增加了显著价格变动的可能性。 价格目标:三角形的垂直高度通常在最宽点(最高点和水平支撑线之间)测量。从该点到突破点的距离被预测为潜在价格目标。 什么是对称三角形模式? 对称三角形由收敛趋势线组成,它们在一点处相交形成三角形形状。该模式表示不确定时期和潜在的价格突破。 该模式的明确性质也可以反映市场动态,可以利用其形成更复杂的交易策略,例如分析看涨或看跌情景。 对称三角形模式的指标有哪些? 价格行为和趋势线:对称三角形模式由两条线组成——第一条上升的低点线和第二条连接一系列下降高点的线。然后趋势线收敛形成一个完美的对称三角形。当价格两次与每条趋势线相交,导致多个接触点时,该模式得到确认。 成交量分析:在对称三角形形成过程中观察交易量至关重要。随着价格接近三角形的最右角,交易量趋于下降,这表明市场活动和信心低下。 持续时间:对称三角形模式通常是短期模式。 突破确认:交易者通常寻求明确的突破,这通常伴随着交易量增加和突破方向的显著价格变动。模式稳健性的确认是未来交易决策的基础。 测量目标:交易者通常采用测量技术来确定突破后的潜在价格目标。该技术涉及确定三角形在最宽点的高度(趋势线之间的垂直距离),并将从该点到突破方向的距离投射。这可以用来估计粗略的价格变动目标。 如何使用延续模式进行交易: 1. 识别趋势线 检查图表上已有的模式——延续模式之前价格是否有任何差异? 如果是,它是增加还是减少?这在确定潜在突破中起着作用。 2. 找到突破点 交易者只能根据突破点和趋势方向获利。一些人可能在反转期间获利。 3. 交易 进行您的交易。 本系列的第四部分将涵盖延续模式中的颈线模式,例如杯柄形、头肩形以及如何识别它们。 除了理论,如果您希望开始在 BitMEX 上交易加密衍生品或现货,您可以在此处找到我们所有现有产品。有关 BitMEX 交易的更多教育资源,特别是衍生品,请访问此页面。要第一时间了解我们的新上架、产品发布、豪礼大放送等,我们邀请您加入我们的在线社区之一,并与其他交易者联系。要了解最新信息,您还可以关注我们的 Twitter,或阅读我们的博客和网站公告。 Related Source…

  • Warning Sign? US Job Openings Plunge to 3.5-Year Low as Labor Market Weakens

    US job openings have dropped to their lowest level in three and a half years in July, to 7.67 million, from 7.91 million in June, while available vacancies “materially missed expectations of 8.09 million.” According to the economics outlet Kobeissi Letter on the microblogging platform X (formerly known as Twitter), since seeing a peak in March 2022,…

Leave a Reply

Your email address will not be published. Required fields are marked *