Elevate Your Trading Skills: How To Build An SMC Trade Plan
Week Three Starts Here. Concepts End. Application Begins.
Welcome back. For fourteen days you’ve been building a toolkit. Market structure. Liquidity. Order blocks. FVGs. BOS and CHoCH. Inducement. Kill zones. MTF analysis. Breaker blocks. OTE. PD arrays. POIs.
That toolkit is now complete.
Week 3 is different. We stop studying the tools in isolation and start using them together the way professional traders actually use them — as a single, end-to-end process that turns a blank chart into a structured, rule-based trade plan.
Today is the SMC version. Day 16 covers the ICT version. The comparison will show you exactly where the two methodologies converge and where they diverge at the execution level.
Let’s build the SMC trade plan from scratch.
Why You Need a Trade Plan Before You Touch a Chart
Most beginners open a chart and immediately start looking for something to trade. That is the wrong sequence entirely.
Professional SMC traders start with a narrative — a written or mentally rehearsed story of what the market has done, what it is doing now, and what it is most likely to do next. The chart is consulted to confirm or deny that narrative, not to generate ideas spontaneously.
Without a plan, every candle looks like an opportunity. With a plan, most of the chart becomes irrelevant — you are waiting patiently for one specific scenario to play out, and everything else gets ignored.
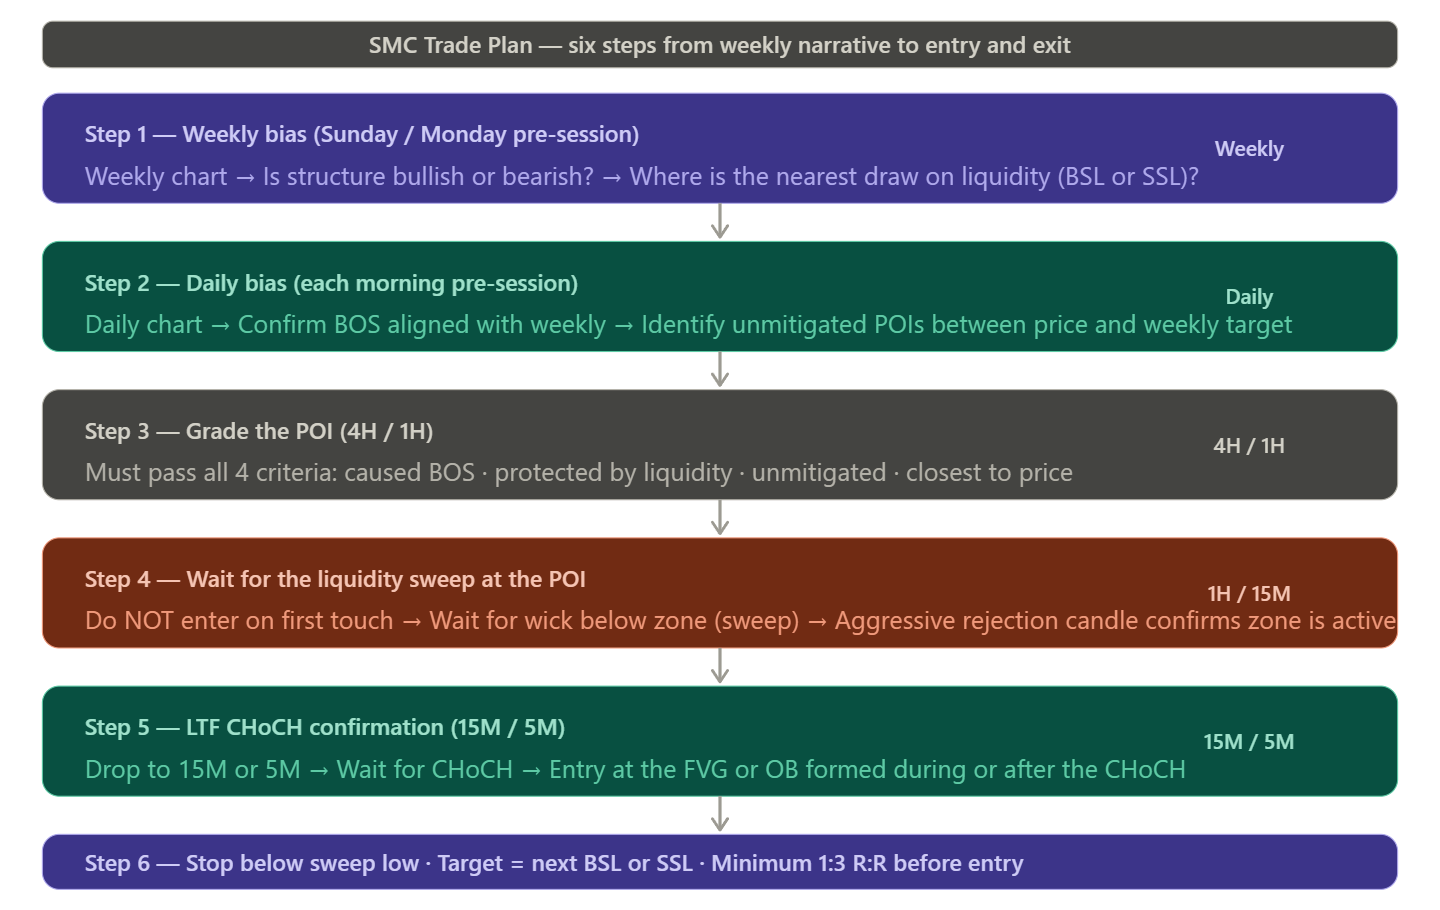
Here is the complete SMC trade plan framework, step by step.
Step 1 — Establish the Weekly Bias (Sunday or Monday Pre-Session)
Before the week begins, open the weekly chart. Ask two questions:
Where is price in the larger structure? Is it making higher highs and higher lows (bullish), lower lows and lower highs (bearish), or grinding sideways inside a range?
Where is the nearest draw on liquidity? Scan for the closest BSL (buy-side liquidity above equal highs or a previous swing high) or SSL (sell-side liquidity below equal lows or a previous swing low). That is the most likely weekly target — the destination price is being pulled toward.
Write it down in plain language: “Weekly structure is bullish. Price has swept last week’s low and created a CHoCH. Nearest draw on liquidity is the previous weekly high at X.”
That sentence is your weekly narrative. Everything this week is filtered through it.
Step 2 — Build the Daily Bias (Each Morning Pre-Session)
Drop to the daily chart. This is where you make a go or no-go decision for the day.
Confirm that price is moving in the direction your weekly narrative described. Look for the most recent BOS or CHoCH on the daily chart — is it aligned with the weekly? Identify where today’s key POIs sit. Are there any unmitigated daily order blocks, FVGs, or breaker blocks between current price and the weekly draw on liquidity?
Also check: has price already reached the daily draw on liquidity? If so, the daily narrative may be exhausted — it is a day to stay out, not to force trades in a depleted range.
Write your daily bias: “Daily is bullish. Last BOS was at X. Price is retracing. Nearest unmitigated bullish POI is the 4H order block at Y. Looking for longs.”
Step 3 — Identify and Grade Your POI (4H / 1H)
Drop to the 4H and 1H charts. Your job here is to identify the specific zone price is most likely to react from when the pullback completes.
Apply the four SMC POI quality criteria from Day 14:
Is it unmitigated? The zone must never have been fully retested since it formed. Did it cause a BOS or structural shift? The move away from this zone must have been impulsive and resulted in a break of structure. Is it protected by liquidity? There should be a pool of resting orders — equal lows, an inducement sweep — sitting just below the zone. That liquidity gives institutions a reason to defend it. Is it the closest POI to current price? Of all the zones that qualify, trade from the nearest one first.
If the zone passes all four filters, it is your active POI for the session. If no zone passes, there is no trade today.
Step 4 — Wait for the Liquidity Sweep
This is the step that most beginners skip — and it is the most important one.
Before price reacts from your POI, it will almost always make one final move to collect liquidity. That means dipping slightly below your zone’s low (in a bullish setup) to trigger the stop losses of traders who entered too early — then aggressively reversing.
Do not enter when price first touches your POI. Wait. Watch for the wick below the zone, the aggressive rejection candle, the volume spike. That sweep is institutional confirmation that the zone is active and that the move is about to begin.
If price slices cleanly through your POI without any rejection or sweep, the zone is invalidated. There is no trade. This discipline alone saves you from the majority of losing entries.
Step 5 — Confirm on the Lower Timeframe (15M / 5M)
Once the sweep has occurred and price is showing rejection at your POI, drop to the 15-minute or 5-minute chart. You are looking for one specific confirmation signal: a CHoCH.
The CHoCH on the lower timeframe is the market telling you that the short-term retracement is finished and the higher-timeframe direction is resuming. It is the shift from bearish internal structure (the pullback) to bullish internal structure (the continuation) — visible only on the execution timeframe.
The entry is placed at the FVG or order block that forms during or immediately after the LTF CHoCH. This is your precision entry — not at the top of the POI zone, not at a guess, but at the specific candle where institutional participation is confirmed.
Step 6 — Place the Stop and Define the Target
Stop loss: Below the low of the liquidity sweep candle. Not below the POI zone broadly — below the actual wick that swept the liquidity. This is the tightest valid stop placement and produces the best risk-reward ratio.
If price returns below that sweep low, it means the institutional reaction failed. The zone has been mitigated. Your trade idea is wrong. The stop placement reflects that logic precisely.
Target: The next draw on liquidity in the direction of the trade. In a bullish setup that means the nearest BSL — equal highs, a prior swing high, or the weekly liquidity target identified in Step 1. Never guess at a target. Always name it before you enter.
Minimum risk-reward: SMC practitioners consistently recommend a minimum of 1:3 before taking any trade. If the distance from entry to stop is larger than one-third the distance from entry to target, the trade does not qualify.
 -- How To Build An Smc Trade Plan")
The Complete SMC Checklist — Print This and Use It
Before pressing the buy or sell button, every one of these must be true:
☐ Weekly bias is defined and written down
☐ Daily BOS confirms the weekly direction
☐ An unmitigated POI has been identified and graded
☐ POI passes all four quality criteria
☐ Price has swept liquidity at or below the POI before entry
☐ A CHoCH has formed on the 15M or 5M chart at the POI
☐ Entry is at the FVG or OB created during the CHoCH
☐ Stop is below the sweep low — not below the zone broadly
☐ Target is a named liquidity level — not a round number guess
☐ Risk-reward is at least 1:3
If any box is unchecked, there is no trade. You wait. The market will give you another opportunity. This is not a strategy of finding trades — it is a strategy of qualifying them.
What Makes SMC Different From ICT in Trade Building
The SMC trade plan works entirely off structural logic and the four POI quality criteria. Time is advisory — SMC traders are aware of London and New York sessions and prefer to enter during high-liquidity windows, but the plan does not require a Kill Zone to be valid.
Tomorrow’s lecture builds the ICT version of the same trade plan. You’ll see exactly how Huddleston’s approach adds time-based mandatory filters — the Kill Zone, the daily bias tied to the Interbank Price Delivery Algorithm — that make the entry criteria stricter and in some cases more mechanical.
Both plans are built on the same foundation. The ICT plan has more rules. The SMC plan gives more discretion. Neither is objectively better — it depends entirely on whether you thrive with rigid structure or prefer contextual flexibility.
Up Next — Day 16
Tomorrow: the ICT version of this exact trade plan. Same six-stage process, but you’ll see how Kill Zones, the daily bias framework, IPDA concepts, and specific Fibonacci confirmation change the entry workflow. If you’ve ever wondered why ICT traders talk about time so much — Day 16 answers that in full.
→ See you on Day 16.