Day 16: How To Build An ICT Trade Plan — Daily Bias, Kill Zones & Judas Swing | Trading Strategy Guides
The ICT Version. Same Foundation. Stricter Rules.
Welcome back. Yesterday you built the SMC trade plan — a six-step framework from weekly narrative to LTF entry, driven by structural logic and four POI quality criteria, with time as an optional factor.
Today you build the ICT version of the same plan. The concepts are familiar. The critical difference is that ICT treats time as mandatory, not optional. Every element of the ICT trade plan has both a price condition and a time condition that must be satisfied simultaneously. Miss either one and the setup doesn’t qualify — regardless of how clean it looks on the chart.
This is the filter that makes ICT more mechanical, more precise, and — for many traders — more psychologically demanding to execute. Let’s build it.
The Foundation: IPDA — Why Price Moves When It Does
Before building the ICT trade plan, you need to understand the framework Huddleston uses to explain why price behaves the way it does. He calls it the Interbank Price Delivery Algorithm — IPDA.
The core idea is that price movement is not random. It is a systematic, algorithmically delivered process designed to seek out liquidity and rebalance price inefficiencies. The algorithm has two primary objectives: hunt liquidity pools (stops resting above highs and below lows), and fill price imbalances (FVGs and volume voids left behind by fast moves).
Practically, this means that every day, price is being delivered with a purpose. It is either hunting the previous high or low to collect stops, or it is returning to fill an imbalance before continuing. Your job as an ICT trader is to identify which objective the algorithm is currently pursuing — and position yourself in alignment with it.
IPDA also operates on time-based cycles. Liquidity pools form approximately every 20 trading days, and the algorithm typically shifts its delivery direction at 20, 40, and 60-day intervals. While deep IPDA analysis is an advanced topic on its own, the practical takeaway for trade planning is simple: look at the highs and lows of the past 20, 40, and 60 trading days. Those external levels are the most likely draw on liquidity targets for the current move.
Step 1 — Establish the IPDA Narrative (Weekly, Pre-Session)
Open the weekly chart. Identify the 20-day, 40-day, and 60-day highs and lows. This tells you where price has been — and where the algorithm’s most likely targets sit.
Ask: is price currently expanding away from a range, retracing after a move, or consolidating building for the next leg?
Then identify the next draw on liquidity. In a bullish narrative, that is the nearest BSL — the 20-day high, a prior weekly swing high, or equal highs that have accumulated retail buy stops. In a bearish narrative, it is the nearest SSL — the 20-day low or prior swing lows.
Write the IPDA narrative in plain language: “Price has swept the 20-day low. IPDA is now bullish. The 40-day high at X is the next probable draw on liquidity.”
Step 2 — Set the Daily Bias (Each Morning, Before the London Open)
Drop to the daily chart. The ICT daily bias is the anticipated direction of price delivery for that specific day — and it must be established before any Kill Zone begins. Traders who establish bias during a Kill Zone are already reacting, not planning.
To establish daily bias in ICT, check three things:
Where is price relative to yesterday’s high and low? If it opened above yesterday’s high, the algorithm may be distributing. If it opened below yesterday’s low, it may be accumulating for a push higher.
Is there an unmitigated PD array between current price and the IPDA target? The first bullish PD array price encounters in the discount zone is your candidate entry zone for the day.
Is there a Judas Swing setup brewing? This is the ICT-specific manipulation pattern that forms at session openings — and understanding it is the key to avoiding the single biggest trap in ICT trading.
Write the daily bias: “Daily bias bullish. Price in discount. Unmitigated bullish OB at Y. Expecting Judas Swing below Asian low during London open, then expansion to Z.”
Step 3 — Identify the Judas Swing (The Manipulation Phase)
This is the concept that separates ICT traders from everyone else — and the one that trips up beginners most consistently.
Huddleston named it the Judas Swing after the biblical betrayal narrative. Like Judas, it appears to be moving in one direction while actually leading price to be sacrificed in the opposite direction.
Here is what it looks like in practice: your daily bias is bullish. London opens at 2am EST. Instead of immediately moving higher, price drops — sharply and aggressively — below the Asian session low. Retail traders who entered longs overnight get stopped out. Breakout traders short the move believing a bearish day is beginning.
Then, within minutes, price reverses violently. The Asian low has been swept. Retail stop losses have been collected. The algorithm now has the liquidity it needed to fuel the true bullish move. The Judas Swing is complete.
The Judas Swing forms between New York midnight and 5:00am EST, aligning with the London Kill Zone window. In a bullish day, the Judas Swing is a false move lower. In a bearish day, it is a false move higher. It is the manipulation phase of the AMD model (Accumulation → Manipulation → Distribution) applied at the intraday level.
The rule: do not enter any trade during the Judas Swing. Wait for it to complete — confirmed by the liquidity sweep and a clear market structure shift in the direction of your daily bias.
Step 4 — Wait for MSS With Displacement (Still in the Kill Zone)
Once the Judas Swing has swept liquidity, you are watching for the Market Structure Shift (MSS) — a decisive break of the most recent lower high (in a bullish setup) with a large-bodied displacement candle that leaves an FVG behind.
This is the algorithm confirming its true intention. The displacement candle — big-bodied, minimal wicking, and creating a clear FVG — is institutional order flow entering the market at scale. Without displacement, the MSS is weak. With displacement, it is a high-confidence signal.
The displacement candle and the FVG it creates become your entry zone.
Step 5 — Enter the PD Array During the Kill Zone
This is where ICT’s mandatory time filter becomes critical. The FVG or OB formed during the displacement must be within the active Kill Zone window to be valid.
An FVG that forms during the London Kill Zone (2am–5am EST) is a high-probability ICT entry. The identical FVG forming at 11am EST — outside any Kill Zone — is treated as low-probability and should be skipped regardless of how clean the structure looks.
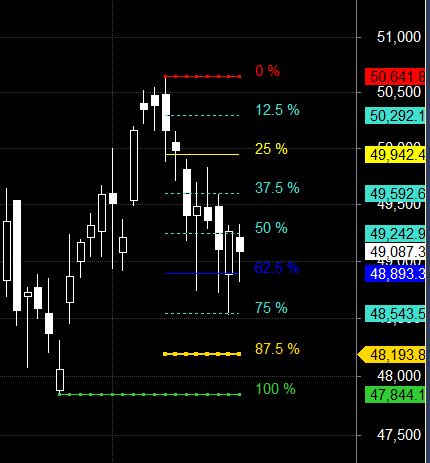
The entry itself is simple: when price retraces into the FVG created by the displacement candle, you enter in the direction of the daily bias. Alternatively, use the OTE framework from Day 13 — draw Fibonacci from the swing low of the Judas Swing to the displacement high, wait for the 62%–79% retracement, and enter at 70.5%.

Step 6 — Stop Placement and Targets
Stop loss: Below the low of the Judas Swing for a bullish trade — the wick that swept the SSL. That level is the structural invalidation point. If price returns below it, the Judas Swing itself was not the manipulation phase — the entire bias was wrong.
Target 1: The -0.27 Fibonacci extension of the Judas Swing leg. As covered in Day 13, this is the standard institutional profit target where most intraday ICT setups reach exhaustion. Many ICT traders take half their position here and move the stop to break-even.
Target 2: The next IPDA draw on liquidity identified in Step 1 — the 20-day or 40-day high, or the prior swing high where BSL rests. This is the full expansion target reserved for days when the bias is confirmed, the Kill Zone produced clean displacement, and the daily structure is clearly trending.
The Complete ICT Pre-Trade Checklist
Before entering any ICT trade, every condition below must be satisfied:
☐ IPDA narrative written — 20/40/60-day highs and lows marked
☐ Daily bias established before London open — discount or premium confirmed
☐ Nearest PD array identified and in the correct zone
☐ Judas Swing has completed — liquidity swept, false move confirmed over
☐ MSS formed with displacement — large-bodied candle, FVG visible
☐ Entry zone (FVG or OTE) is inside an active Kill Zone
☐ Stop is below the Judas Swing low — not below the POI broadly
☐ Target 1 is at the -0.27 extension
☐ Target 2 is the named IPDA draw on liquidity
☐ Risk per trade does not exceed 1–2% of account
If the Judas Swing has not yet formed — wait. If the MSS did not produce displacement — skip. If the setup forms outside a Kill Zone — do not enter it.
ICT vs SMC Trade Plan — The Key Differences Side by Side
Both plans use the same tools. Both start with a weekly narrative and drill down to an execution timeframe. But the differences at the execution level are significant enough to matter.
SMC approach: Four POI quality criteria filter the zone. Time is advisory. Entry is the LTF CHoCH confirmation. No strict session requirement.
ICT approach: PD array must be in the correct premium or discount zone. Kill Zone is mandatory. The Judas Swing must complete first. Displacement must accompany the MSS. OTE can replace the CHoCH as an entry trigger.
The ICT plan has more mandatory conditions. Each condition that is added reduces the frequency of setups and increases the precision of those that remain. This is why ICT traders often take fewer trades per week than SMC traders — but target significantly higher risk-reward ratios per trade.
Neither approach is superior in absolute terms. What matters is which set of rules you can follow with complete consistency — because inconsistency, not the strategy itself, is what destroys most traders.
Up Next — Day 17
Tomorrow we go into an area that most trading content glosses over but that determines whether any strategy — SMC or ICT — actually survives long-term: risk management. Position sizing, the 1% rule, moving stops to break-even, managing runners, and the psychology of cutting losses early. Without this, the best trade plan in the world still blows an account eventually.
→ See you on Day 17.