Ethereum Price Analysis: ETH Support Levels & ETF Impact


Ethereum continues to draw strong attention from traders and beginners alike, especially as the market shows a mix of stability and hidden weakness. While ETH holds near $2300 and records steady short-term gains, deeper technical signals suggest that momentum may not be as strong as it looks at first glance. This creates an interesting setup, where both bullish and bearish scenarios remain possible.

In this Ethereum price analysis, you will learn what really drives the current trend, which levels matter most, and how traders interpret key indicators. If you want to understand where ETH could move next and how to react, it is worth diving deeper into the full analysis.
Current Ethereum Market Overview
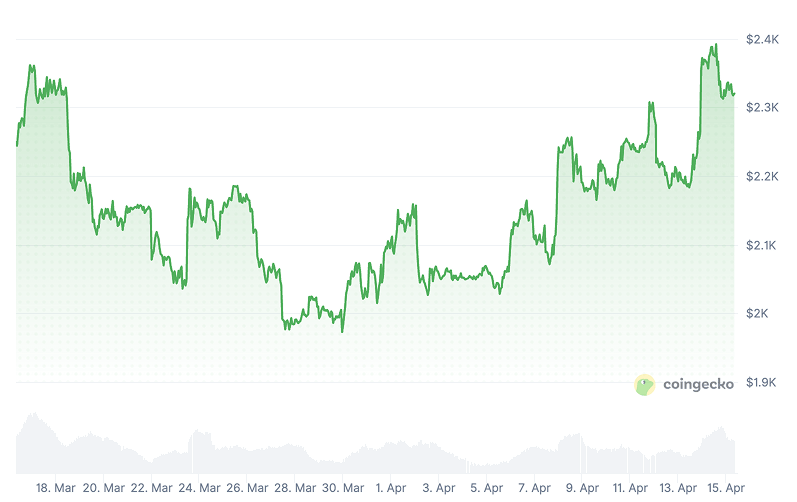
According to the latest Ethereum price news, ETH currently trades around $2,320, maintaining its position as the second-largest cryptocurrency by market capitalization. The asset shows strong liquidity, with a 24-hour trading volume of over $22 billion, which reflects consistent market activity.
CoinGecko, April 15, 2026
In terms of performance, Ethereum lost 2.4% in the last 24 hours, while it increased by 3.4% over 7 days and 2.5% over the past 30 days, which indicates steady but controlled growth. The circulating supply stands at 120.69 million ETH, matching the total supply.
At the same time, Ethereum holds around 10–11% market dominance, confirming its strong role in the crypto ecosystem.
ETH Technical Analysis
In Ethereum technical analysis, traders study charts to understand price direction and find better entry points. They focus on patterns, trends, and key price levels that often act as turning points. This approach helps reduce emotional decisions and improves timing, especially in a volatile market like crypto.
Investing, April 15, 2026
Key Support and Resistance Levels
In Ethereum technical analysis resistance levels, traders track key zones where price often reacts. Strong support appears near $2,130, $1,950, and $1,880, where buyers previously stepped in. Resistance levels sit around $2,350, $2,600, and $2,800, where selling pressure increases. These levels reflect past price action and also act as psychological barriers, since traders place orders around round numbers and previous highs or lows.
| Level Type | Price (USD) | Technical Rationale |
| Major Resistance 2 | $2,830 | Upper pivot range, strong rejection zone |
| Major Resistance 1 | $2,600 | Key breakout level from the previous structure |
| Current Price | ~$2,320 | Trading near a short-term resistance cluster |
| Immediate Support | $2,130 | Pivot point and short-term demand zone |
| Critical Support | $1,880 | Strong historical support and accumulation area |
| Major Support 2 | $1,655 | Fibonacci support and previous consolidation base |
Chart Patterns and Trend Analysis
The current ETH price chart analysis shows a weak short-term downtrend, while the long-term structure remains bullish. Price moves below key moving averages, which signals pressure. At the same time, ETH forms a consolidation range, which may lead to a breakout. If price breaks above $2,350, momentum could increase. However, a drop below $2,130 may trigger further downside.
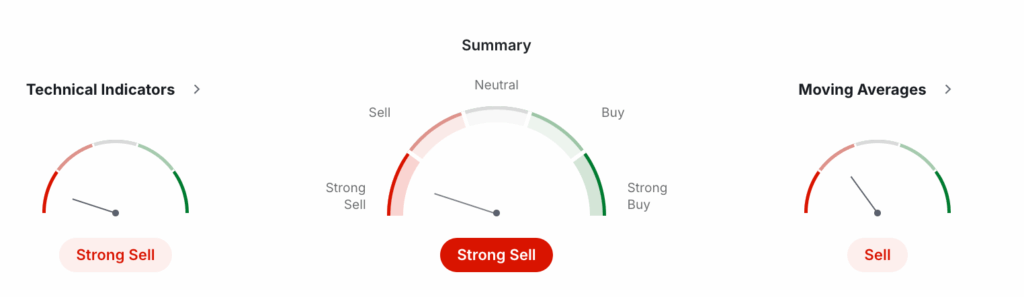
Essential Technical Indicators
When analyzing ETH technical indicators, most signals still lean bearish, although some short-term recovery signs appear. Moving averages confirm weakness, since short-term averages remain below long-term ones. The RSI at 46 stays neutral, so momentum remains unclear. Meanwhile, MACD shows a mild bullish crossover, but it lacks strong follow-through.
Recent Bollinger Bands data shows compression after expansion, which often signals a coming volatility move. ETH recently touched the upper band near $2,380 and faced rejection, which suggests selling pressure at higher levels.
At the same time, volume spikes during price drops confirm real selling activity, not just low liquidity noise. This means bears still control the market in key moments. Fibonacci levels continue to support the $1,950–$2,130 zone, while tight bands and mixed signals suggest ETH may soon break out of its current range.
Ethereum Network Upgrades and Their Price Impact
Ethereum continues to evolve through upgrades that focus on scalability, lower fees, and better user experience. Recent improvements, especially after EIP-4844 and ongoing rollup expansion, significantly reduced transaction costs and increased network capacity. In 2026, average gas fees dropped to around $0.05 for swap, with even lower costs during low-demand periods.
At the same time, the upcoming Glamsterdam upgrade (expected in 2026) aims to further improve throughput and decentralization. Historically, major upgrades like The Merge triggered strong price reactions, as investors priced in long-term efficiency gains. Therefore, technical progress often supports Ethereum’s long-term value, even if short-term price moves remain volatile.
| Metric | Ethereum L1 | Layer 2 Total (Base, Arbitrum, etc.) |
| Daily Transactions | ~2 Million | ~2.0 Million+ |
| Total Value Locked | ~$55 Billion | ~$37 Billion+ |
| Average Gas Fee | ~$0.05 | ~$0.001 – $0.05 |
| Network Role | Security & Settlement Layer | Scalability & Mass Adoption Layer |
Layer 2 networks now process a large share of Ethereum activity, often exceeding mainnet transaction volume. This shift shows that Ethereum evolves into a settlement layer, while L2 solutions drive real user growth and adoption.
Price Predictions and Analyst Forecasts
Any Ethereum price outlook remains speculative, so it should support analysis, not replace risk management. For that reason, it makes sense to review short-term scenarios first and then compare them with broader analyst targets and current market catalysts.
Short-Term Price Outlook (1-3 months)
The bullish case points to $2,400-$2,600 if ETH clears resistance near $2,388-$2,400, whale accumulation continues, and macro sentiment stays supportive. The bearish case targets $2,138 first, then roughly $2,000-$2,100 if support fails. Based on current signals, a rebound looks slightly more likely, around 55% bullish vs 45% bearish, but conviction still looks limited.
Medium-Term Projections (6-12 months)
Fresh analyst commentary still leans constructive on Ethereum over the next 6-12 months. A recent roundup highlighted targets such as $10,000-$20,000 from Arthur Hayes and $15,000 by 2027 from Standard Chartered, though those are longer-range calls. For a more realistic medium-term view, the current market structure supports a broad $2,500-$4,500 range if ETF demand, network upgrades, and stablecoin growth keep improving.
Factors Influencing Ethereum Price
The Ethereum vs Bitcoin performance in 2026 depends strongly on macro conditions. When the Federal Reserve keeps high interest rates, investors reduce risk exposure, which pressures ETH. However, lower rates often boost crypto demand. At the same time, inflation data and global liquidity trends directly impact capital flows into digital assets.
Regulation also plays a key role, especially in ETF developments and compliance rules. In addition, Ethereum closely follows Bitcoin’s trend, so BTC rallies often lift ETH, while BTC drops usually trigger broader market selloffs.
| ETF Provider | Weekly Net Flow (April 2026) | Assets Under Management (AUM) |
| BlackRock (ETHA) | ~$85.2 Million | ~$6.9B cumulative inflows |
| Fidelity (FETH) | ~-$70.6 | ~$1.34B cumulative inflows |
| Grayscale (ETHE) | ~-$3.6 Million | ~$3.46B cumulative inflows |
| Total Market Impact | +-$64M weekly | Bullish but uneven accumulation |
Trading Strategies for Ethereum
Traders use different strategies depending on their goals. Swing trading focuses on capturing moves between support and resistance levels over several days or weeks. Day trading relies on short-term volatility and quick entries. Long-term investors accumulate ETH during dips and hold through cycles.
Risk management remains essential, so traders limit positions to a small percentage of capital and set stop-loss orders below key support levels. A common approach is to enter near support and exit near resistance, while adjusting strategy based on trend direction.
How to Trade Ethereum on StealthEX
StealthEX allows users to trade Ethereum quickly and without registration. The platform offers no KYC, competitive rates, fast processing, and access to 2,000+ trading pairs, which makes it beginner-friendly and efficient.
- Visit StealthEX.io and select Ethereum (ETH) with your desired trading pair.
- Enter the amount you want to exchange and review the current rate.
- Provide your receiving ETH wallet address carefully.
- Send your crypto to the generated deposit address.
- Wait for the transaction to process on the network.
- Receive ETH directly in your wallet, usually within minutes.
Conclusion: Is Now the Right Time to Trade Ethereum?
Ethereum shows a mixed setup, which creates both opportunity and risk. On one hand, price holds near $2300, and the network continues to grow through upgrades and Layer 2 adoption. On the other hand, technical indicators still lean bearish, which suggests caution in the short term.
Because of this, traders should not rush decisions. A breakout above resistance may confirm strength, while a drop below support could open further downside. Therefore, the best approach is to combine technical analysis with market context and risk management. Ethereum remains a strong long-term asset, but timing matters.
Frequently Asked Questions
Why Is Ethereum Dropping Today?
Ethereum often drops due to short-term factors such as profit-taking, broader market selloffs, or negative macro news. In addition, large whale transfers and weak technical signals can increase selling pressure. Short-term volatility remains normal in crypto markets.
Why Is Ethereum Going Up Today?
Ethereum usually rises when positive sentiment returns to the market. This can include strong Bitcoin performance, increased institutional demand, or positive news about network upgrades. Breaking key resistance levels also attracts new buyers and momentum traders.
How Do Spot ETH ETF Inflows Impact the Market?
Spot ETF inflows create direct buying pressure because funds must purchase real ETH. This increases demand and can support higher prices. Over time, ETFs also attract institutional capital, which improves liquidity and strengthens long-term market stability.
Make sure to follow StealthEX on Medium, X, Telegram, YouTube, and Publish0x to stay updated about the latest news on StealthEX and the rest of the crypto world.
Don’t forget to do your own research before buying any crypto. The views and opinions expressed in this article are solely those of the author.
ETH ETH price prediction Ethereum Ethereum price prediction What is EthereumSource link