Guerilla Trading

In the dynamic world of financial markets, effective risk management has become paramount. For guerrilla trading—a high-frequency and high-risk trading strategy—the importance of robust risk mitigation tools is even more pronounced. Industry experts foresee significant changes on the horizon, driven by technological advancements and evolving strategies. This lesson explores the emerging trends in risk management for guerrilla trading and why they matter for investors.
Automation: Revolutionizing Risk Mitigation
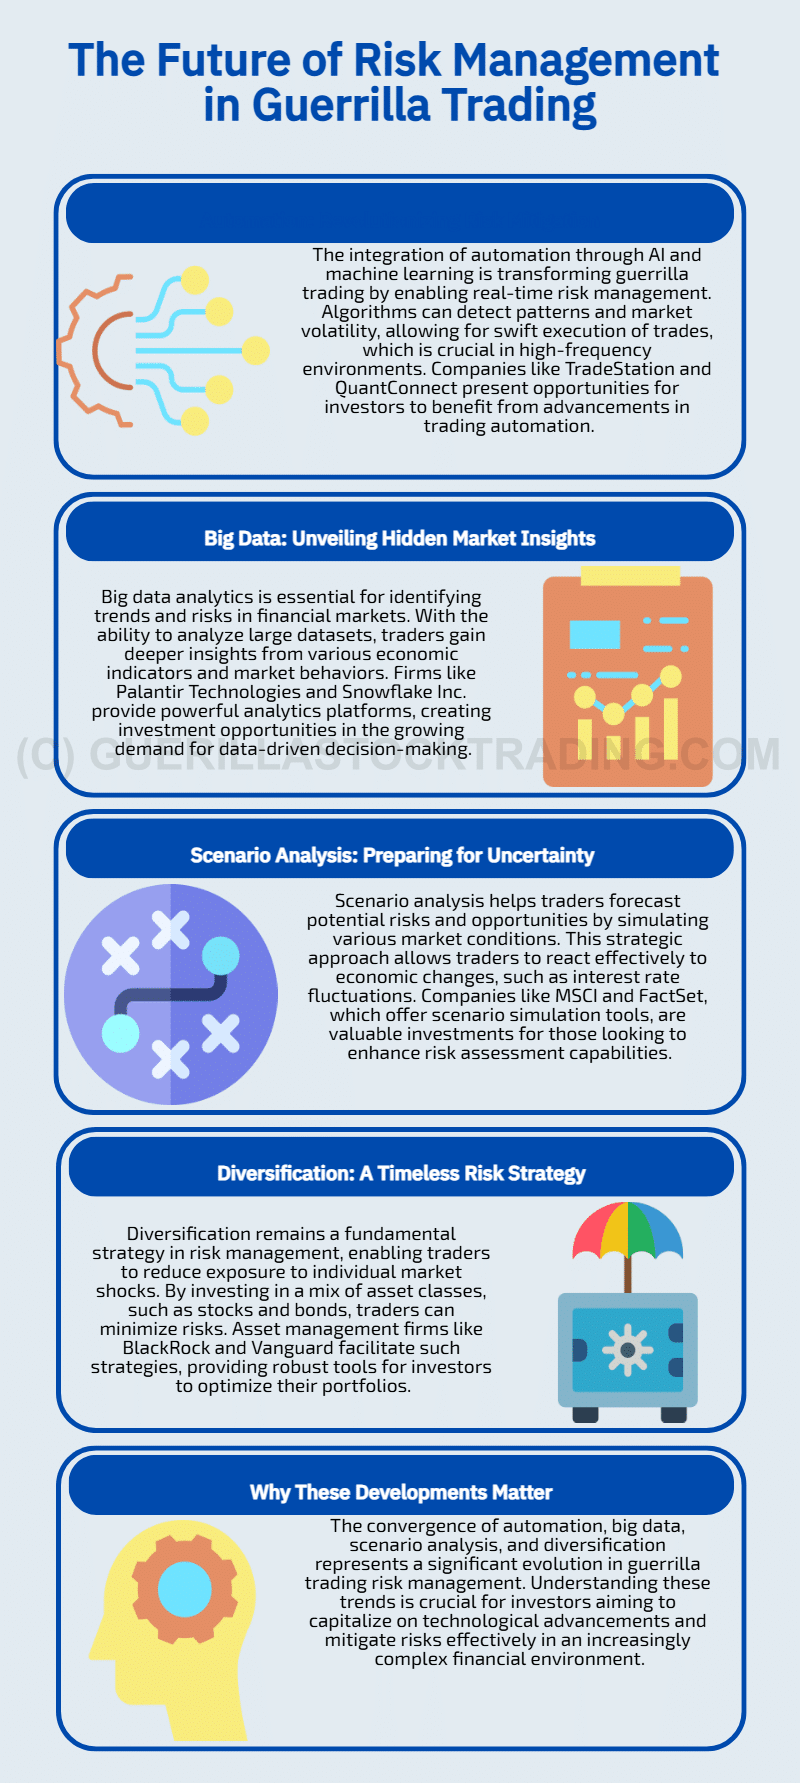
One of the most transformative trends in guerrilla trading is the integration of automation, powered by artificial intelligence (AI) and machine learning. Automation enables traders to manage risks more efficiently by identifying and responding to threats in real time. Algorithms monitor market volatility, detect patterns, and execute trades when specific thresholds are triggered.
For investors, companies specializing in trading automation, like TradeStation or QuantConnect, offer substantial opportunities. Their solutions reduce manual intervention, enhance accuracy, and improve trading speed—key factors in volatile markets. Keeping an eye on such firms is essential, as they are at the forefront of reshaping trading strategies and risk management.
Big Data: Unveiling Hidden Market Insights
Big data analytics is another crucial pillar in the future of risk management. By analyzing vast datasets, traders can uncover trends and patterns that are not immediately apparent. Insights from news events, global economic indicators, and market behavior provide a deeper understanding of potential risks.
Companies like Palantir Technologies and Snowflake Inc., known for their data analytics capabilities, are pivotal in this space. Their platforms empower traders and businesses to make data-driven decisions, offering investors exposure to the growing demand for sophisticated analytics tools.
Scenario Analysis: Preparing for Uncertainty
Scenario analysis involves evaluating hypothetical situations to predict potential risks and opportunities. This method equips traders with strategies to navigate market shifts, such as changes in interest rates or geopolitical events. By simulating various scenarios, traders can better prepare for potential disruptions.
Investment in companies offering scenario simulation tools, such as MSCI or FactSet, can prove lucrative for investors. These firms play a critical role in risk assessment and provide essential tools for financial professionals managing unpredictable market conditions.
Diversification: A Timeless Risk Strategy
Diversification remains a cornerstone of risk management in guerrilla trading. By spreading investments across multiple asset classes, traders can minimize exposure to individual market shocks. For example, a diversified portfolio might include stocks, bondsUnited States Treasury securities are debt instruments issued by the United States government to finance its spending. Treasury securities come in a variety of forms, including bil…, and commodities.
Asset management firms like BlackRock and Vanguard are key players driving diversification strategies. Their exchange-traded funds (ETFs) and managed portfolios provide investors with robust tools to reduce risk and optimize returns, making them vital for long-term market strategies.
The future of risk management in guerrilla trading represents a convergence of innovation and necessity. Automation enhances efficiency, big data offers clarity, scenario analysis prepares for uncertainty, and diversification ensures stability. For investors, understanding and tracking the companies leading these trends is critical.
Understanding and Managing Risks in Guerrilla Trading
Guerrilla trading, a high-risk strategy focused on capitalizing on short-term price movements, has the potential for lucrative gains but also comes with significant risks. To succeed, traders must understand these risks and implement robust management strategies.
High Volatility: Managing Market Unpredictability
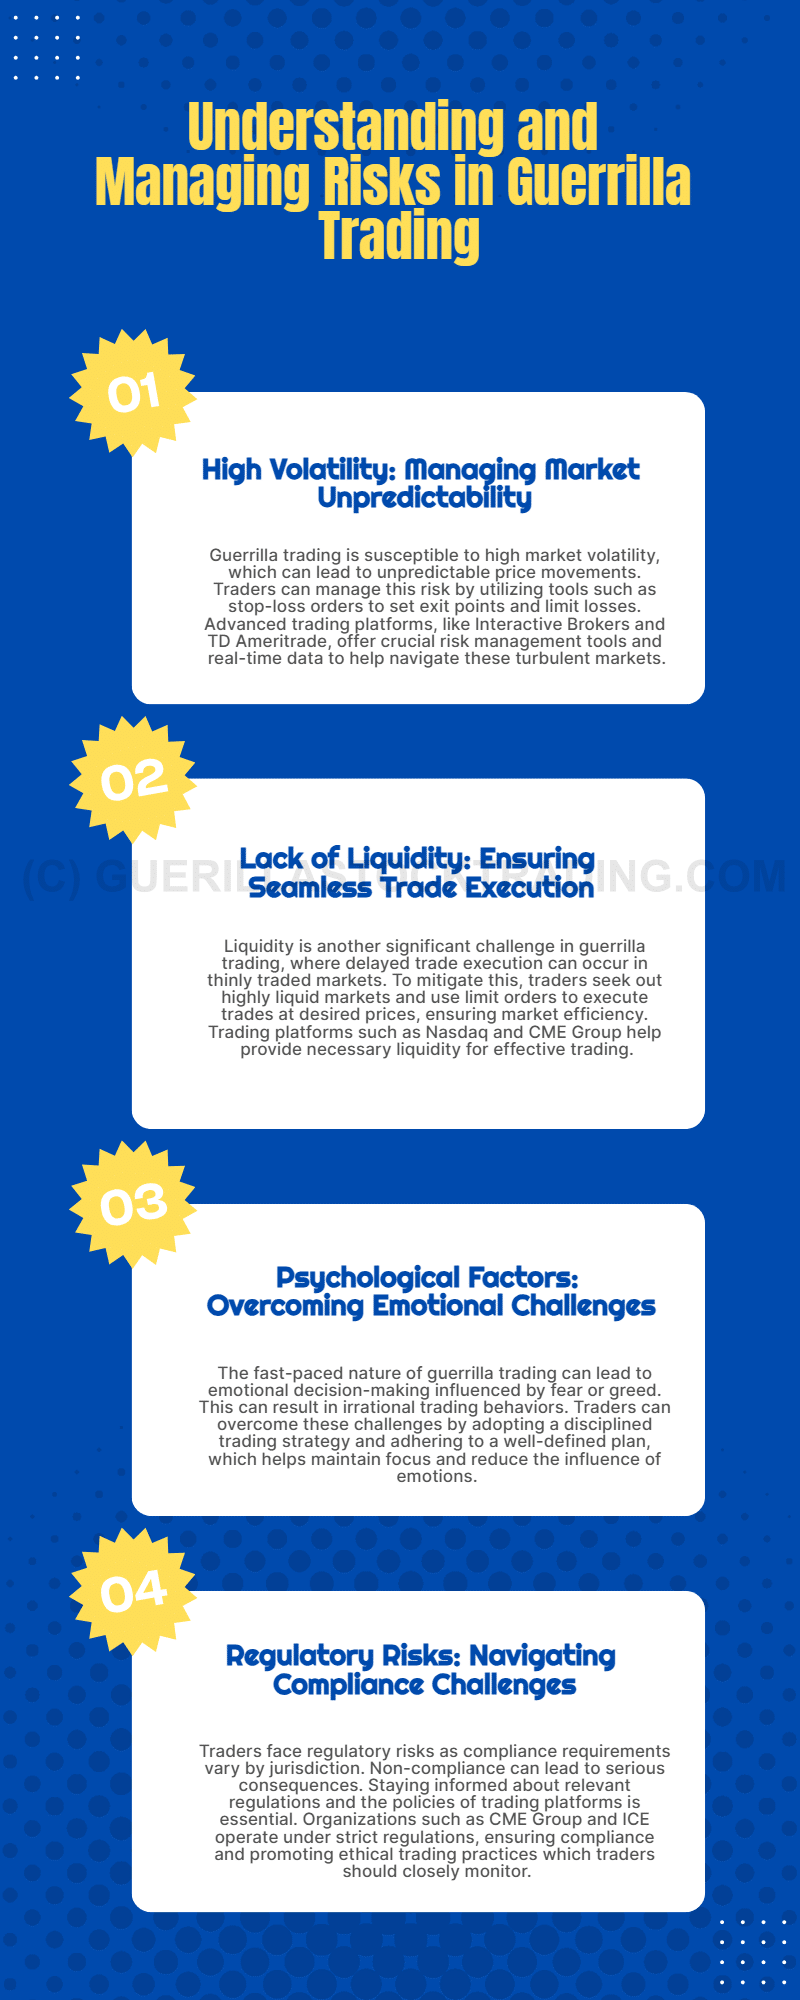
One of the most prominent risks in guerrilla trading is high market volatility. Price movements can be erratic, making it challenging to forecast future trends accurately. Poorly managed trades in such environments can result in significant losses.
To counter this risk, traders rely on tools like stop-loss orders to set predetermined exit points, limiting potential losses. Companies offering advanced trading platforms, such as Interactive Brokers and TD Ameritrade, are essential for investors to follow. Their sophisticated risk management tools and real-time data analytics enable traders to navigate volatile markets effectively.
Lack of Liquidity: Ensuring Seamless Trade Execution
Liquidity issues pose another significant challenge in guerrilla trading. Thinly traded markets can hinder quick entry and exit, leading to missed opportunities or unfavorable execution prices.
To address this, traders focus on highly liquid markets and use limit orders to ensure trades are executed at desired prices. Stock exchanges and trading platforms like Nasdaq and CME Group play a pivotal role in providing liquidity. Investors should monitor these entities as they ensure market efficiency and support diverse trading strategies.
Psychological Factors: Overcoming Emotional Challenges
Guerrilla trading’s fast-paced nature can lead to stress and emotional decision-making driven by fear or greed. These psychological factors often result in irrational trades and overtrading, which increase the risk of losses.
A disciplined trading approach, supported by a well-defined plan, is critical for managing psychological challenges.
Regulatory Risks: Navigating Compliance Challenges
The regulatory environment for guerrilla trading varies across jurisdictions. Non-compliance with local or international trading laws can result in severe legal and financial consequences.
Traders must stay informed about relevant regulations and the policies of trading platforms. Companies like CME Group and ICE (Intercontinental Exchange), which operate within strict regulatory frameworks, ensure compliance and transparency. These entities are important for investors to monitor as they shape the trading landscape and promote ethical practices.
Understanding the risks associated with guerrilla trading and the companies providing solutions is crucial for traders and investors alike.
The Role of Technology in Mitigating Risks in Guerrilla Trading
Guerrilla trading, a high-risk style of trading focused on exploiting short-term price movements, offers the potential for significant profits but comes with substantial risks. However, advancements in technology have transformed how traders navigate these challenges. From automated systems to advanced analytics, technology has redefined risk mitigation strategies in guerrilla trading.
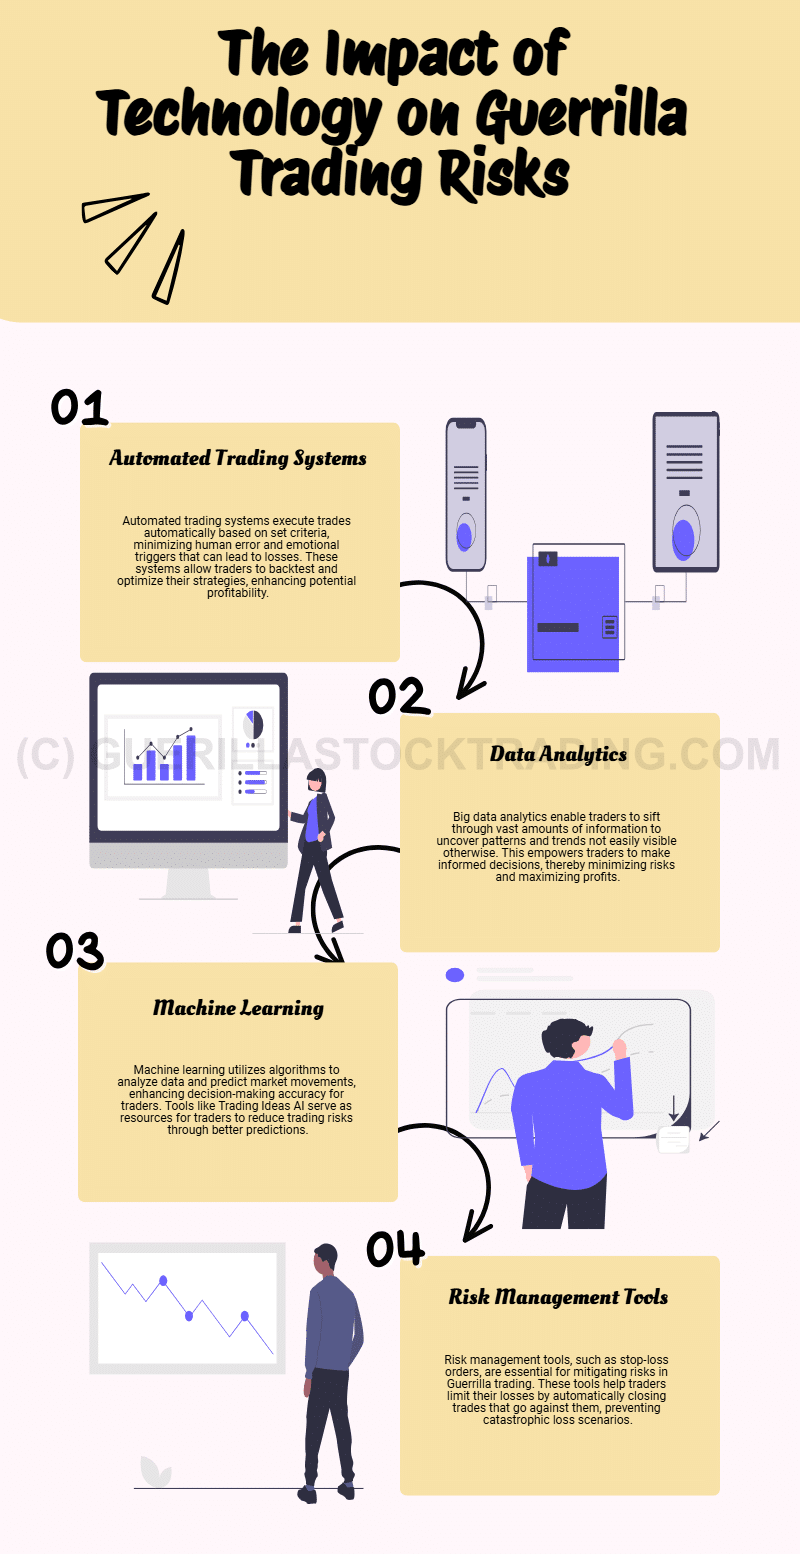
Automated Trading Systems: Reducing Human Error
Automated trading systems execute trades based on pre-set criteria, eliminating the emotional and human errors often associated with trading losses. These systems allow traders to backtest strategies, optimize trades, and maintain consistent performance.
Companies like MetaTrader and Interactive Brokers have pioneered user-friendly platforms for automated trading. Their tools enable traders to execute strategies with precision, making these companies essential for investors to monitor as they push the boundaries of automation in financial markets.
Data Analytics: Unlocking Actionable Insights
Big data analytics has become indispensable for traders aiming to reduce risks in guerrilla trading. By analyzing vast datasets, traders can uncover patterns and trends that are otherwise undetectable. This empowers them to make informed decisions, improve risk assessment, and enhance profitability.
Companies like Palantir Technologies and Snowflake Inc. lead in providing cutting-edge analytics solutions. Their platforms allow traders and organizations to process and analyze market data efficiently, ensuring that they remain ahead in an increasingly data-driven financial landscape.
Machine Learning: Enhancing Predictive Accuracy
Machine learning, a subset of artificial intelligence, uses algorithms trained on historical data to predict market movements. In guerrilla trading, machine learning tools help traders identify patterns and make more accurate forecasts, thereby reducing risks.
Platforms like Trading Ideas AI offer accessible machine learning solutions for traders. Investors should keep an eye on such platforms as they continue to democratize AI-driven trading strategies, making advanced tools available to a broader audience.
Risk Management Tools: Safeguarding Against Losses
Risk management tools, such as stop-loss orders, are critical for mitigating risks in guerrilla trading. These tools automatically close trades if the market moves unfavorably, limiting potential losses and safeguarding capital.
Brokerages like Charles Schwab and TD Ameritrade excel in offering comprehensive risk management features. Their platforms provide traders with the flexibility to implement advanced risk controls, ensuring a balanced approach to high-risk trading strategies.
Technology’s role in reducing risks in guerrilla trading extends beyond individual traders; it impacts the broader financial ecosystem. Companies like Interactive Brokers, Palantir, and Trading Idea’s AI are at the forefront of innovation, offering tools that improve trading efficiency, accuracy, and profitability.
By following these organizations, investors gain insights into the evolving landscape of trading technology. As guerrilla trading continues to grow, the companies driving advancements in automation, analytics, machine learning, and risk management will shape the future of financial markets and present lucrative opportunities for investors.
The Importance of Position Sizing in Guerrilla Trading
Guerrilla trading, a fast-paced style of trading that capitalizes on short-term price movements, relies heavily on precision and strategy. One of the most critical components of success in this trading approach is position sizing—the allocation of capital to each trade. This concept plays a pivotal role in optimizing gains while minimizing potential losses, making it essential for traders aiming for consistent profitability.
Understanding Position Sizing in Guerrilla Trading
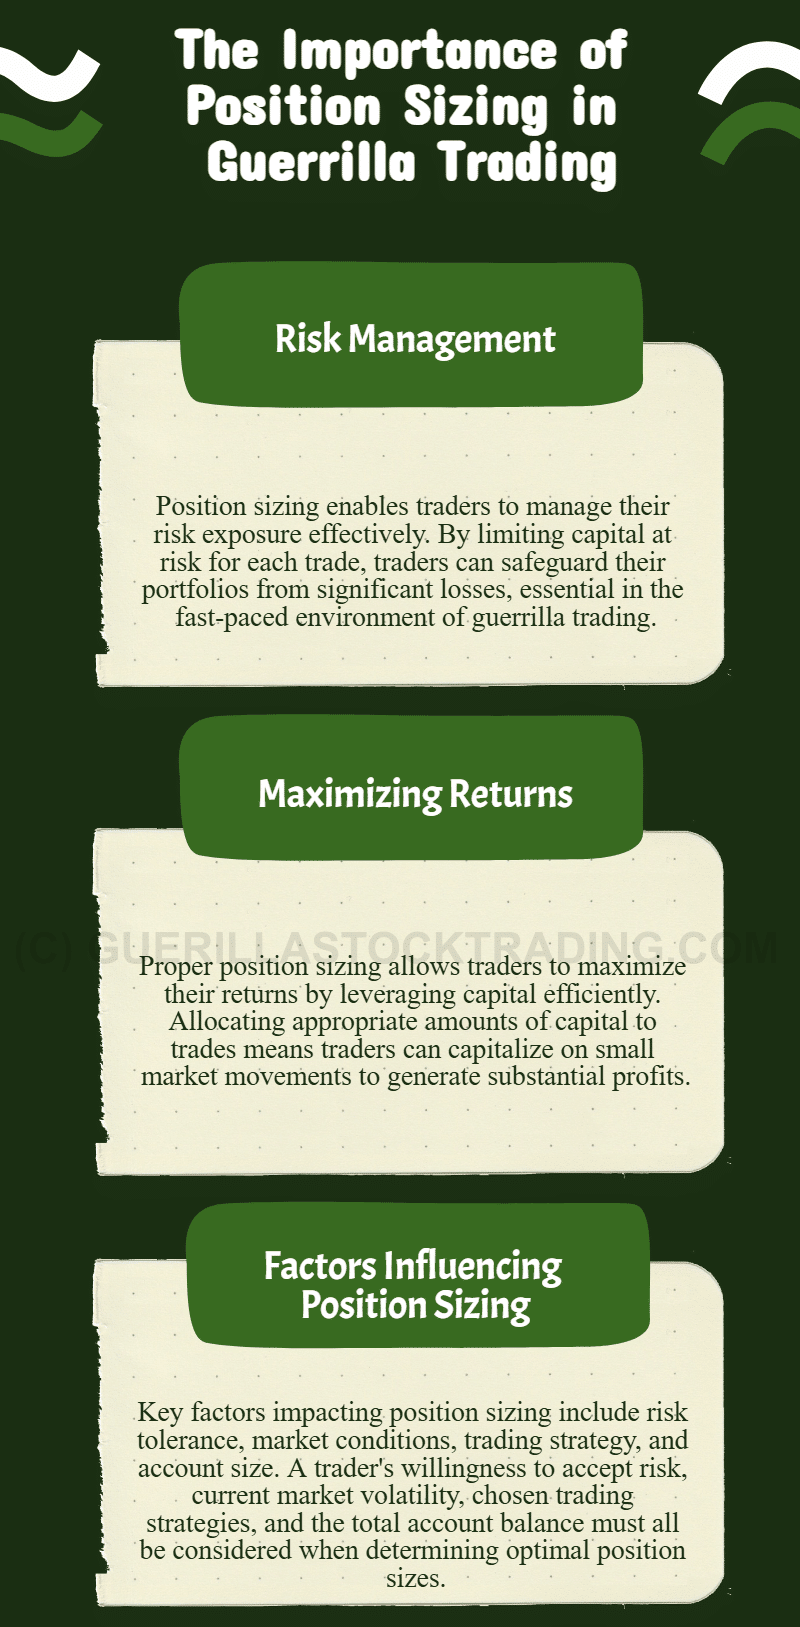
Position sizing refers to the calculated amount of capital allocated to individual trades. In guerrilla trading, where speed and efficiency are paramount, position sizing becomes a cornerstone of risk management and profit optimization. The goal is to strike a balance between maximizing returns and protecting the portfolio from significant downturns.
By employing effective position sizing, traders can better manage their risk exposure and make the most of their capital. This approach ensures that even minor market movements can yield substantial profits without jeopardizing the overall portfolio.
Key Factors in Position Sizing
Several factors influence position sizing decisions in guerrilla trading. Understanding and implementing these considerations is vital for traders to thrive in volatile market conditions.
1. Risk Tolerance
Risk tolerance is the foundation of position sizing. It defines the level of risk a trader is willing to take on for each trade. Establishing a clear risk threshold is crucial to avoid overexposure. Traders must strike a balance between taking calculated risks and safeguarding their portfolio against potential losses. Adopting a disciplined approach to risk tolerance helps maintain trading longevity and financial stability.
2. Market Conditions
The dynamic nature of market conditions directly impacts position sizing. In highly volatile markets, reducing position sizes can be a prudent strategy to limit losses from unpredictable price swings. Conversely, in more stable environments, traders might consider larger position sizes to capitalize on predictable movements. Flexibility and adaptability are key to navigating these shifts effectively.
3. Trading Strategy
Different trading strategies require tailored position sizing. For instance, a trend-following strategy often involves larger position sizes for trades that align with clear trends, as they carry a higher probability of success. Conversely, scalping strategies—focused on small, frequent profits—might benefit from smaller position sizes to spread risk across multiple trades. Aligning position sizing with the chosen strategy ensures optimal capital utilization.
4. Account Size
Account size is another critical determinant of position sizing. Traders with smaller accounts need to exercise caution to avoid excessive exposure that could lead to significant losses. Allocating a smaller percentage of the account per trade allows for greater resilience, enabling traders to recover from setbacks and continue trading effectively. For larger accounts, careful management still applies to preserve capital while leveraging opportunities.
Investors and traders alike benefit from understanding the principles of position sizing. For traders in guerrilla trading, this strategy safeguards against unnecessary risks while enabling efficient capital utilization. It fosters a disciplined approach that can be applied across various market conditions and trading styles.
Moreover, position sizing contributes to consistency—a key factor in long-term success. By carefully managing risk and maximizing returns, traders can build a sustainable and profitable trading strategy.
Mastering Position Sizing in Guerrilla Trading
Position sizing is a fundamental aspect of successful trading, determining the number of shares or contracts to trade based on account size, risk tolerance, and market conditions. For guerrilla traders—who operate in high-risk, high-reward environments—flexible position sizing is essential. This approach allows traders to adapt to varying market conditions and optimize their strategies for maximum gains.
The Importance of Adjusting Position Sizing
Guerrilla trading relies on swift, calculated moves in volatile markets. By tailoring position sizes to match specific market conditions, traders can manage risk effectively while capitalizing on opportunities. Here’s how position sizing can be adjusted in different scenarios.
Understanding Market Conditions
Market conditions play a pivotal role in determining position sizes. Broadly, these conditions can be categorized as trending, ranging, or volatile:
- Trending Markets: In markets with clear upward or downward trends, traders can increase position sizes to capitalize on strong price movements.
- Ranging Markets: In sideways markets, smaller position sizes help mitigate the risk of false breakouts.
- Volatile Markets: High volatility requires reduced position sizes to minimize the impact of unpredictable price swings.
By aligning position sizes with market conditions, traders can better manage their exposure and enhance profitability.
Using Technical Analysis
Technical analysis is invaluable for identifying market conditions and guiding position sizing decisions. For example:
- Trending Markets: Higher highs and higher lows signal uptrends, while lower highs and lower lows indicate downtrends.
- Ranging Markets: Price charts that show horizontal movement between support and resistance levels suggest a range-bound market.
Indicators like Bollinger BandsJohn Bollinger, a financial analyst and trader, invented Bollinger Bands in the early 1980s. He designed this technical analysis tool to measure market volatility and provide insig…, RSIIn the world of technical analysis, the Relative Strength Index (RSI) stands as a cornerstone tool for traders seeking insights into market momentum. Developed by J. Welles Wilder …, and moving averagesThe concept of moving averages dates back to the early 20th century. While it is challenging to attribute the invention of moving averages to a single individual, W. P. Hamilton, a… can provide additional confirmation, enabling traders to fine-tune their position sizes.
Adjusting Risk per Trade
Risk management is central to position sizing. Traders should determine a fixed percentage of their account to risk on each trade. For instance:
- Fixed Risk Example: A trader with a $10,000 account risks 2% per trade, setting a maximum loss of $200.
- Dynamic Adjustment: In volatile markets, reducing risk per trade to 1% or less can prevent excessive losses during sharp price swings.
This approach ensures that position sizes remain proportional to risk tolerance and market conditions.
Considering Market Volatility
Volatility has a direct impact on position sizing. Wide price swings require smaller positions to avoid being stopped out prematurely. Conversely, in calmer markets, traders may increase position sizes to leverage steady price movements. Tools like the Average True Range (ATR) can help gauge volatility and adjust position sizes accordingly.
Keeping a Trading Journal
A trading journal is an essential tool for tracking performance and refining strategies. By recording trade details, market conditions, and outcomes, traders can identify patterns and make informed adjustments. For example, if losses frequently occur in volatile markets, reducing position sizes during such conditions can improve results.
For guerrilla traders, effective position sizing is a cornerstone of risk management and profitability. Investors, too, can learn from these principles, applying them to portfolio allocation and market exposure. By understanding how market conditions influence risk and returns, both traders and investors can make more informed decisions.
Mastering position sizing is a critical skill for guerrilla traders seeking to navigate dynamic markets. By understanding market conditions, leveraging technical analysis, adjusting risk per trade, accounting for volatility, and maintaining a trading journal, traders can optimize their strategies for success. With disciplined execution and adaptability, position sizing becomes a powerful tool for maximizing gains while minimizing risks.
Position sizing is an essential aspect of any successful trading strategy. It determines the number of shares or contracts a trader should buy or sell based on factors such as account size, risk tolerance, and market conditions. For guerrilla traders—who operate in fast-paced, high-risk environments—position sizing becomes a key tool for optimizing returns while minimizing risk exposure.
Position sizing is more than just a calculation; it’s a risk management strategy that can make or break a trader’s success. By managing the amount of capital allocated to each trade, traders can reduce the impact of losses and ensure consistent growth in their accounts. For guerrilla traders, where speed and precision are crucial, position sizing helps maintain control in volatile markets.
Popular Position Sizing Methodologies
Traders use various methodologies to determine the ideal position size. Each approach has its strengths and is suited to different trading styles and market conditions.
Fixed Fractional Position Sizing
This intuitive method involves risking a fixed percentage of the trading account on each trade. For instance, if a trader decides to risk 2% of their $10,000 account, they would allocate $200 to each trade.
- Advantages: Simple to calculate and ensures proportional risk as the account balance changes.
- Why It Works: Fixed fractional sizing prevents overexposure to any single trade, helping traders sustain their accounts during losing streaks.
Kelly Criterion
The Kelly criterion is a mathematically complex formula that considers the trader’s edge—expected return—and the probability of winning or losing a trade. It calculates the optimal position size to maximize returns while managing risk.
- Advantages: Highly effective when accurate estimates of edge and probabilities are available.
- Challenges: Requires precise data, which can be difficult to determine in real-world trading.
Volatility-Based Position Sizing
This approach adjusts position size based on the volatility of the asset being traded. More volatile assets require smaller positions to mitigate risk, while less volatile assets allow for larger positions.
- Advantages: Accounts for the inherent risk of the asset.
- Example: A trader might risk 1% of their account on a highly volatile cryptocurrency but 5% on a stable blue-chip stock.
Factors to Consider in Position Sizing
In addition to these methodologies, traders should factor in:
- Stop-Loss Orders: The size of the stop-loss determines how much risk is taken on each trade.
- Expected Holding Period: Longer trades may require smaller position sizes to account for greater uncertainty.
- Liquidity of the Asset: Illiquid assets may necessitate smaller positions to avoid slippage.
For guerrilla traders, position sizing is indispensable for surviving and thriving in volatile markets. Investors also benefit from understanding these principles, as they apply to broader portfolio management. Allocating capital thoughtfully helps reduce risk and improve returns, whether trading equities, commodities, or cryptocurrencies.
Position sizing is a critical skill for traders, especially those engaged in guerrilla trading. By adopting systematic methods like fixed fractional sizing, the Kelly criterion, or volatility-based sizing, traders can align their strategies with their risk tolerance and market conditions. Thoughtful position sizing ensures traders can maximize gains, minimize losses, and navigate the complexities of dynamic markets with confidence.
Common Position Sizing Mistakes to Avoid in Guerrilla Trading
Position sizing is a cornerstone of successful trading strategies, yet it is frequently overlooked or misunderstood. In guerrilla trading, where precision and speed are paramount, proper position sizing becomes even more critical. Many traders fall into common pitfalls that can undermine their profitability and expose them to excessive risk. Understanding and avoiding these mistakes can significantly enhance a trader’s performance and capital preservation.
Why Position Sizing Matters in Guerrilla Trading
Position sizing determines how much capital a trader allocates to each trade. In guerrilla trading, characterized by rapid, high-intensity trades, small miscalculations can lead to significant consequences. Proper sizing helps manage risk and ensures that losses from individual trades do not derail overall profitability.
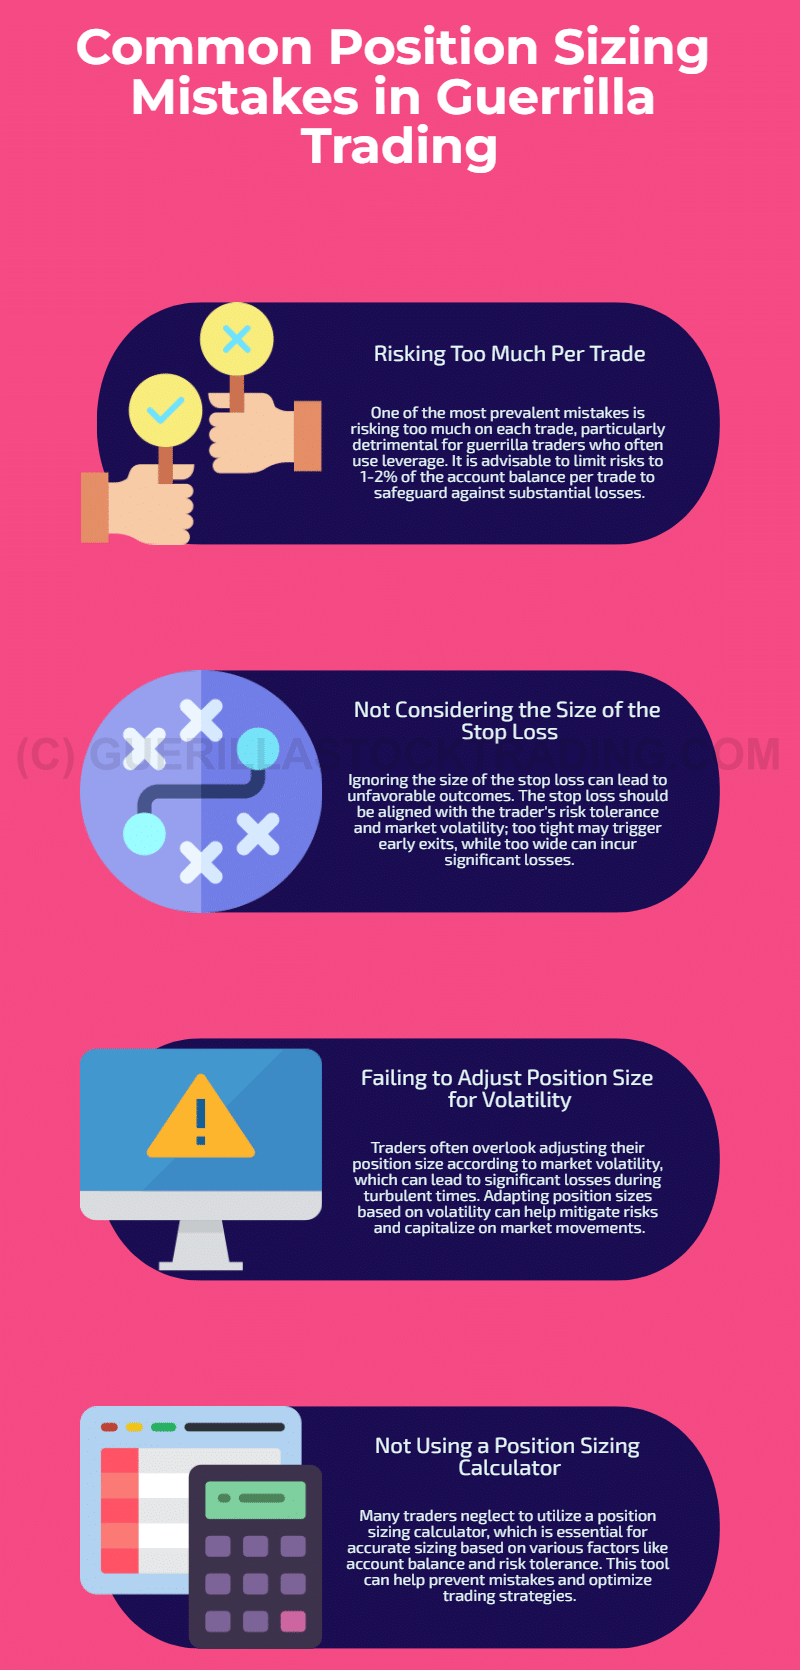
1. Risking Too Much Per Trade
One of the most frequent mistakes is risking too much capital on a single trade. This issue is particularly acute for guerrilla traders, who often employ leverage to amplify returns. Overexposure to a single trade can rapidly deplete an account, even for traders with a profitable strategy.
As a general guideline, traders should limit their risk to 1-2% of their total account balance per trade. This disciplined approach ensures that no single loss can significantly harm their portfolio. For investors, this demonstrates the critical importance of managing downside risk—a key factor in sustainable trading.
2. Ignoring the Stop Loss Size
Another common misstep is failing to account for the size of the stop loss when determining position size. A stop loss is a pre-set exit point to limit potential losses, and its size should reflect both the trader’s risk tolerance and the market’s volatility.
If the stop loss is too tight, traders risk being prematurely stopped out of trades, missing potential gains. Conversely, a stop loss that is too wide can result in substantial losses. Striking a balance is crucial. For investors observing guerrilla trading practices, this highlights the need for meticulous planning in risk management.
3. Neglecting to Adjust for Market Volatility
Markets are not static, and volatility plays a significant role in price movements. Many traders mistakenly use a fixed position size, regardless of changing volatility. For instance, trading the same number of shares in a calm market and a highly volatile one can lead to outsized risks or missed opportunities.
Adjusting position sizes to match market conditions allows traders to manage their exposure effectively. For investors, this adaptability underscores the importance of aligning strategies with market dynamics, a principle that applies across all trading styles.
4. Avoiding Position Sizing Calculators
Position sizing involves complex calculations that factor in account size, risk tolerance, stop loss levels, and market volatility. Many traders err by relying on rough estimates instead of precise calculations. Position sizing calculators provide a streamlined way to determine the optimal size for each trade, reducing errors and ensuring a consistent approach.
For investors, this emphasizes the importance of using available tools and technology to enhance decision-making and minimize human error.
Key Takeaways for Investors
For those interested in guerrilla trading or evaluating the practices of active traders, understanding the nuances of position sizing provides valuable insights into effective risk management. Traders who avoid these common pitfalls demonstrate the discipline and strategic planning necessary for long-term success.
By managing risks effectively, traders can protect their capital, maintain consistency, and capitalize on opportunities. For investors, these principles highlight the broader importance of a disciplined approach to risk and reward—key components in achieving sustained profitability in any market environment.
Mastering Support and Resistance for Guerrilla Trading Success
The support and resistance trading strategy is one of the most effective approaches in the financial markets. By leveraging these critical price levels, traders make informed decisions based on the historical behavior of an asset. For guerrilla traders—those aiming for quick profits through rapid market entries and exits—this strategy is especially valuable. It allows them to execute trades with precision while minimizing risks.
Understanding Support and Resistance Levels
Support and resistance are price levels that reflect a significant change in an asset’s direction in the past. Support represents a level where the price tends to stop falling and potentially reverse upward, while resistance is a level where the price often ceases to rise and may turn downward. These levels provide critical reference points for traders to determine entry and exit strategies.
Key Steps to Apply Support and Resistance in Guerrilla Trading
Guerrilla traders must approach support and resistance with a combination of technical analysis and risk management. The following steps highlight best practices for leveraging these levels:
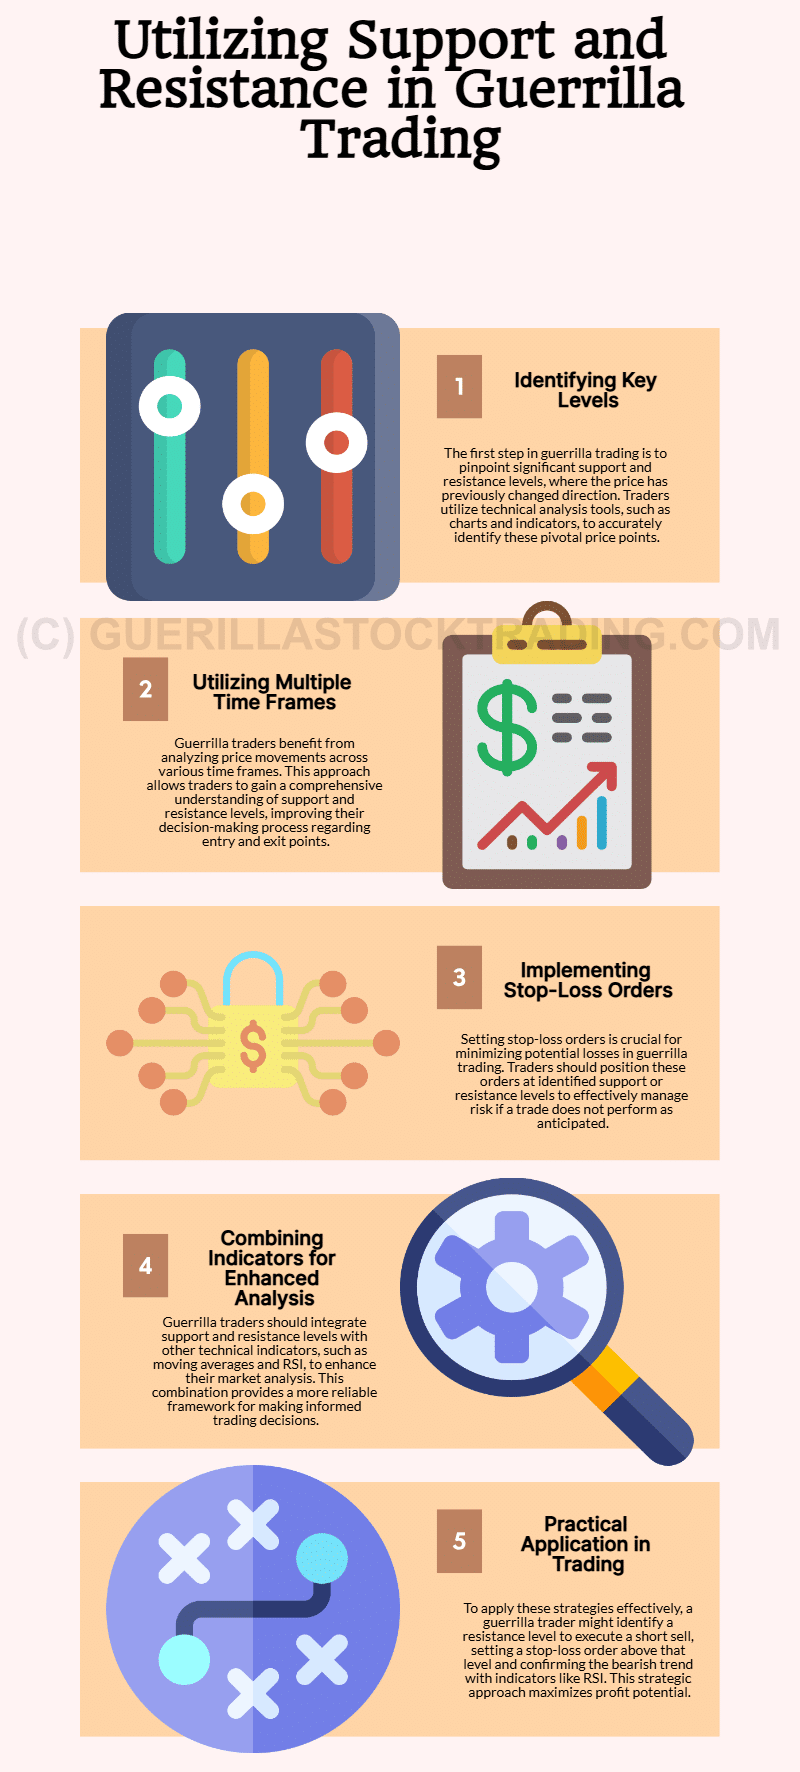
1. Identifying Key Levels
The first step in applying support and resistance is identifying the key levels on a chart. Guerrilla traders rely on tools such as trendlines, candlestickCandlestick chart patterns are visual representations of price movements in financial markets, typically stocks, commodities, or currencies, during a specific time period. Each “ca… patterns, and volume analysis to pinpoint areas where prices have historically reversed or consolidated. These levels become pivotal zones for making trading decisions.
2. Analyzing Multiple Time Frames
To enhance accuracy, traders should analyze price movements across multiple time frames. For instance, a resistance level on a daily chart may also serve as a crucial barrier on a 1-hour chart. Observing the interplay between time frames helps guerrilla traders align short-term movements with broader trends, improving their decision-making.
3. Implementing Stop-Loss Orders
Stop-loss orders are essential for guerrilla traders to manage risk effectively. By setting stop-losses at support or resistance levels, traders can cap potential losses if the market moves against them. This strategy ensures that losses are limited and allows traders to preserve their capital for future opportunities.
4. Combining Indicators for Confirmation
Support and resistance levels become even more powerful when used in conjunction with other technical indicators. Guerrilla traders often combine these levels with tools like moving averagesThe concept of moving averages dates back to the early 20th century. While it is challenging to attribute the invention of moving averages to a single individual, W. P. Hamilton, a…, Bollinger BandsJohn Bollinger, a financial analyst and trader, invented Bollinger Bands in the early 1980s. He designed this technical analysis tool to measure market volatility and provide insig…, or the Relative Strength IndexIn the world of technical analysis, the Relative Strength Index (RSI) stands as a cornerstone tool for traders seeking insights into market momentum. Developed by J. Welles Wilder … (RSIIn the world of technical analysis, the Relative Strength Index (RSI) stands as a cornerstone tool for traders seeking insights into market momentum. Developed by J. Welles Wilder …). For example, when resistance aligns with an overbought RSIIn the world of technical analysis, the Relative Strength Index (RSI) stands as a cornerstone tool for traders seeking insights into market momentum. Developed by J. Welles Wilder … reading, it strengthens the case for a short trade.
A Practical Example of Using Support and Resistance
Consider a guerrilla trader looking to short an asset showing signs of bearish momentum. The trader identifies a resistance level where the price has previously reversed downward. To manage risk, they set a stop-loss order slightly above this level. Additionally, they analyze RSIIn the world of technical analysis, the Relative Strength Index (RSI) stands as a cornerstone tool for traders seeking insights into market momentum. Developed by J. Welles Wilder …, which confirms the asset is overbought. With this confluence of indicators, the trader executes the short trade with confidence.
Understanding support and resistance is not just valuable for guerrilla traders but also for long-term investors. These levels reveal key insights into market psychology, helping to predict price movements. For traders, they provide precise points for entering and exiting trades, enhancing the probability of success. For investors, support and resistance can signal critical levels to buy or sell an asset.
Leveraging Moving Averages in Guerrilla Trading Strategies
Moving averagesThe concept of moving averages dates back to the early 20th century. While it is challenging to attribute the invention of moving averages to a single individual, W. P. Hamilton, a… are a cornerstone of technical analysis, widely regarded for their ability to smooth out price data and highlight trends. Their simplicity and effectiveness make them a go-to indicator for traders, including those engaged in guerrilla trading—a fast-paced trading style focused on short-term opportunities. By understanding how moving averagesThe concept of moving averages dates back to the early 20th century. While it is challenging to attribute the invention of moving averages to a single individual, W. P. Hamilton, a… work and applying them strategically, traders can identify trends and potential reversals, making informed trading decisions.
What Are Moving Averages?
Definition of Moving Averages
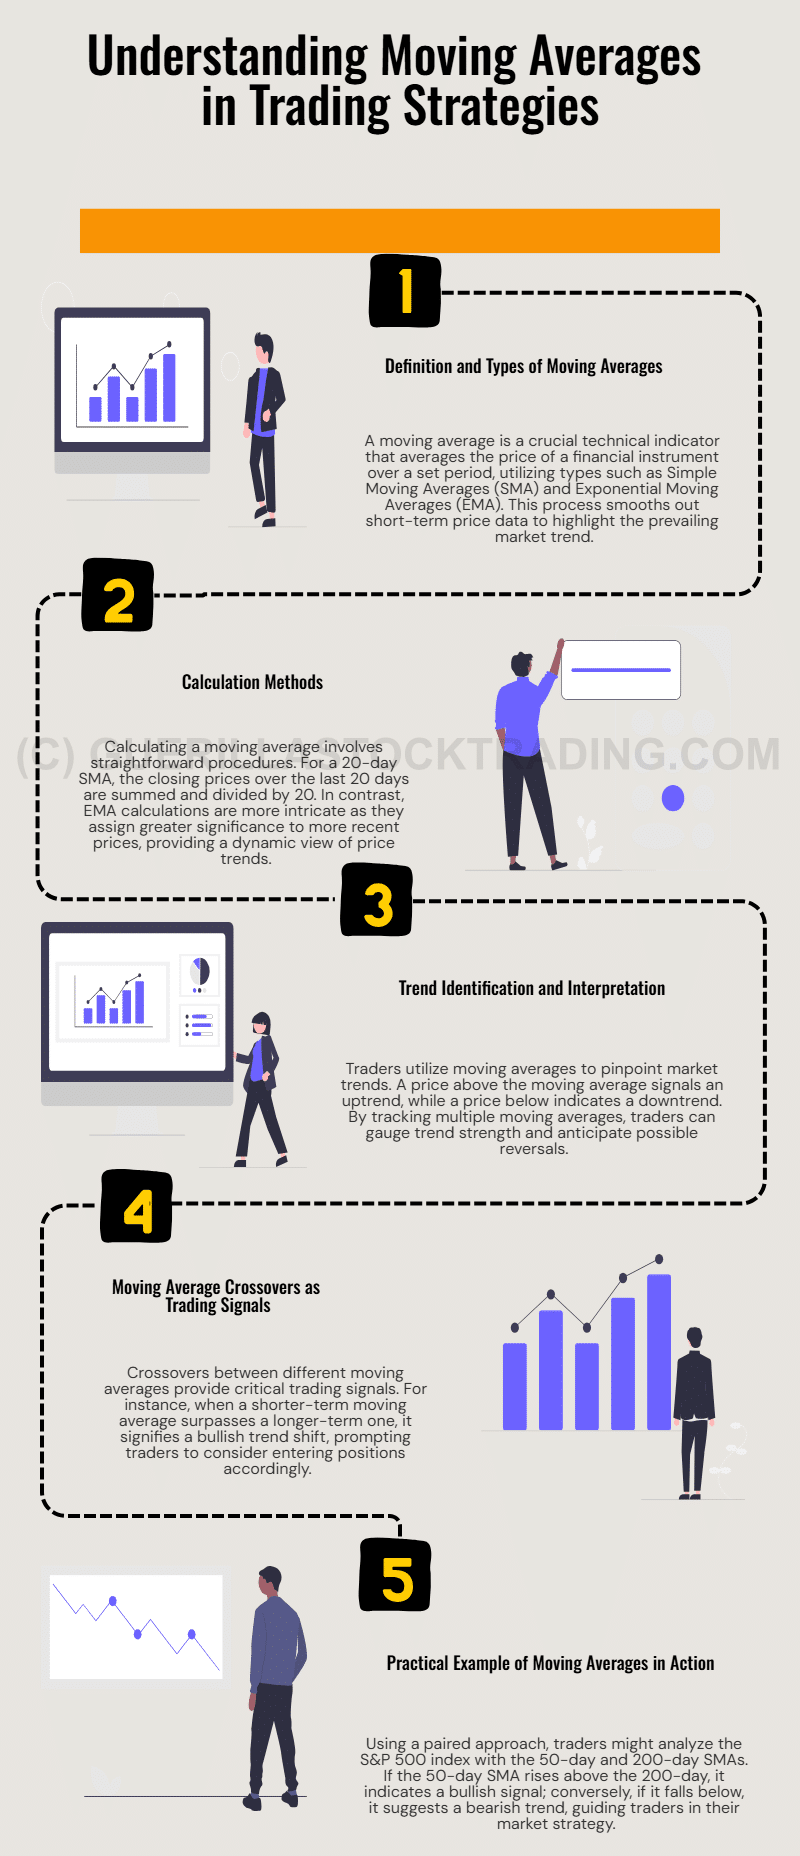
A moving averageThe concept of moving averages dates back to the early 20th century. While it is challenging to attribute the invention of moving averages to a single individual, W. P. Hamilton, a… (MA) is a technical indicator that calculates the average price of a financial instrument over a specific period. It helps traders reduce noise from short-term price fluctuations and gain a clearer picture of the overall trend. There are two primary types:
- Simple Moving AverageThe concept of moving averages dates back to the early 20th century. While it is challenging to attribute the invention of moving averages to a single individual, W. P. Hamilton, a… (SMA): Calculates the average price over a specific time frame, giving equal weight to all data points.
- Exponential Moving AverageThe concept of moving averages dates back to the early 20th century. While it is challenging to attribute the invention of moving averages to a single individual, W. P. Hamilton, a… (EMA): Places greater emphasis on recent prices, making it more responsive to current market conditions.
How Moving Averages Are Calculated
The calculation of an SMA is straightforward. For instance, a 20-day SMA is derived by summing the closing prices of the last 20 days and dividing by 20. The EMA, while slightly more complex, assigns higher importance to recent data points, making it better suited for dynamic markets.
How to Use Moving Averages in Guerrilla Trading
Identifying Trends
Moving averagesThe concept of moving averages dates back to the early 20th century. While it is challenging to attribute the invention of moving averages to a single individual, W. P. Hamilton, a… are pivotal for trend identification. When an asset’s price is above the moving averageThe concept of moving averages dates back to the early 20th century. While it is challenging to attribute the invention of moving averages to a single individual, W. P. Hamilton, a…, it signals an uptrend; when below, it indicates a downtrend. Guerrilla traders rely on this distinction to time their entries and exits with precision, maximizing short-term opportunities.
Spotting Crossovers
Crossovers between moving averagesThe concept of moving averages dates back to the early 20th century. While it is challenging to attribute the invention of moving averages to a single individual, W. P. Hamilton, a… often serve as actionable trading signals. A bullish crossover occurs when a shorter-term moving averageThe concept of moving averages dates back to the early 20th century. While it is challenging to attribute the invention of moving averages to a single individual, W. P. Hamilton, a… (e.g., 50-day SMA) crosses above a longer-term one (e.g., 200-day SMA), signaling a potential uptrend. Conversely, a bearish crossover happens when the shorter-term moving averageThe concept of moving averages dates back to the early 20th century. While it is challenging to attribute the invention of moving averages to a single individual, W. P. Hamilton, a… crosses below the longer-term one, indicating a downtrend. These signals are valuable for guerrilla traders looking to act quickly on emerging trends.
Example Application
Imagine a trader monitoring the S&P 500 using a 50-day and 200-day SMA. If the 50-day SMA rises above the 200-day SMA, this bullish crossover suggests an upward trend. The trader might then enter a long position, aiming to capitalize on the momentum. Conversely, if the 50-day SMA falls below the 200-day SMA, it signals a bearish trend, prompting the trader to consider shorting the index or exiting long positions.
Applying Moving Averages in Guerrilla Trading Strategies
Moving averagesThe concept of moving averages dates back to the early 20th century. While it is challenging to attribute the invention of moving averages to a single individual, W. P. Hamilton, a… are a widely-used tool in technical analysis, particularly useful for guerrilla trading strategies. They help traders identify trends, spot reversals, and refine their trading decisions in fast-paced markets. For traders seeking quick profits, moving averagesThe concept of moving averages dates back to the early 20th century. While it is challenging to attribute the invention of moving averages to a single individual, W. P. Hamilton, a… offer a practical and efficient way to navigate market volatility.
Identifying Trend Reversals
One of the primary uses of moving averagesThe concept of moving averages dates back to the early 20th century. While it is challenging to attribute the invention of moving averages to a single individual, W. P. Hamilton, a… is detecting trend reversals. For example, when an asset’s price crosses above its 50-day simple moving averageThe concept of moving averages dates back to the early 20th century. While it is challenging to attribute the invention of moving averages to a single individual, W. P. Hamilton, a… (SMA), it may indicate the start of an uptrend. Conversely, a price drop below the 50-day SMA could signal the beginning of a downtrend. Traders can use these signals to time their entries and exits effectively, maximizing profits while minimizing losses.
Using Multiple Timeframes
To gain a comprehensive view of the market, traders can analyze moving averagesThe concept of moving averages dates back to the early 20th century. While it is challenging to attribute the invention of moving averages to a single individual, W. P. Hamilton, a… across multiple timeframes. For instance, a trader might use a 10-day SMA on a 15-minute chart to track short-term movements while relying on a 50-day SMA on a daily chart to understand broader trends. This approach allows traders to align their short-term strategies with long-term market dynamics.
Combining Moving Averages
Pairing multiple moving averagesThe concept of moving averages dates back to the early 20th century. While it is challenging to attribute the invention of moving averages to a single individual, W. P. Hamilton, a… can create a more robust strategy. For example, using a 10-day and a 20-day SMA, traders might interpret a crossover of the 10-day SMA above the 20-day SMA as a buy signal. Similarly, a crossover below the 20-day SMA could indicate a sell signal. This method enhances the reliability of trading decisions by confirming trends.
Watching for Crossovers
Moving averageThe concept of moving averages dates back to the early 20th century. While it is challenging to attribute the invention of moving averages to a single individual, W. P. Hamilton, a… crossovers can act as powerful signals for traders. A notable example is the “golden crossWhen the 50 day moving average crosses above the 200 day moving average, it is called a Resurrection Cross. Conversely, when the 50 day moving average crosses below the 200 day mov…,” where the 50-day SMA crosses above the 200-day SMA, often indicating a strong long-term uptrend. Traders can use such signals to enter long positions and ride the trend with confidence.
Moving averagesThe concept of moving averages dates back to the early 20th century. While it is challenging to attribute the invention of moving averages to a single individual, W. P. Hamilton, a… provide essential insights into market trends, making them valuable for traders and investors alike. For guerrilla traders, they facilitate precise and timely decisions. For long-term investors, moving averagesThe concept of moving averages dates back to the early 20th century. While it is challenging to attribute the invention of moving averages to a single individual, W. P. Hamilton, a… highlight key market shifts that can influence broader investment strategies.
Moving averagesThe concept of moving averages dates back to the early 20th century. While it is challenging to attribute the invention of moving averages to a single individual, W. P. Hamilton, a… are not just tools for short-term traders; they hold immense value for long-term investors as well. They provide insights into market trends, helping investors identify strategic entry and exit points. For guerrilla traders, moving averagesThe concept of moving averages dates back to the early 20th century. While it is challenging to attribute the invention of moving averages to a single individual, W. P. Hamilton, a… enable rapid decision-making by highlighting key levels and trend changes.
Moreover, the simplicity of moving averagesThe concept of moving averages dates back to the early 20th century. While it is challenging to attribute the invention of moving averages to a single individual, W. P. Hamilton, a… makes them accessible to traders and investors of all experience levels. Whether trading equities, commodities, or cryptocurrencies, these indicators offer universal applicability.
Moving averagesThe concept of moving averages dates back to the early 20th century. While it is challenging to attribute the invention of moving averages to a single individual, W. P. Hamilton, a… are an indispensable tool for traders, especially those employing guerrilla trading strategies. By smoothing price data, identifying trends, and signaling potential reversals through crossovers, moving averagesThe concept of moving averages dates back to the early 20th century. While it is challenging to attribute the invention of moving averages to a single individual, W. P. Hamilton, a… empower traders to make informed decisions. Their versatility and reliability ensure they remain a vital component of any trading toolkit, providing traders and investors with a clear edge in navigating the markets.
Incorporating Guerrilla Strategies in Day Trading
Guerrilla trading strategies offer a dynamic approach to day trading, enabling traders to capitalize on short-term market movements for rapid profits. In fast-paced and volatile markets, timing and decision-making are critical. By adopting guerrilla strategies, traders can enhance their ability to respond swiftly to price fluctuations, increasing their chances of success.
Why Guerrilla Strategies Work in Day Trading
Guerrilla trading focuses on quick actions and precise timing to exploit short-term opportunities. This style of trading is especially suited to day traders looking to achieve financial goals through fast-paced market participation. Here are the key reasons why guerrilla strategies are effective:
Speed Is Essential
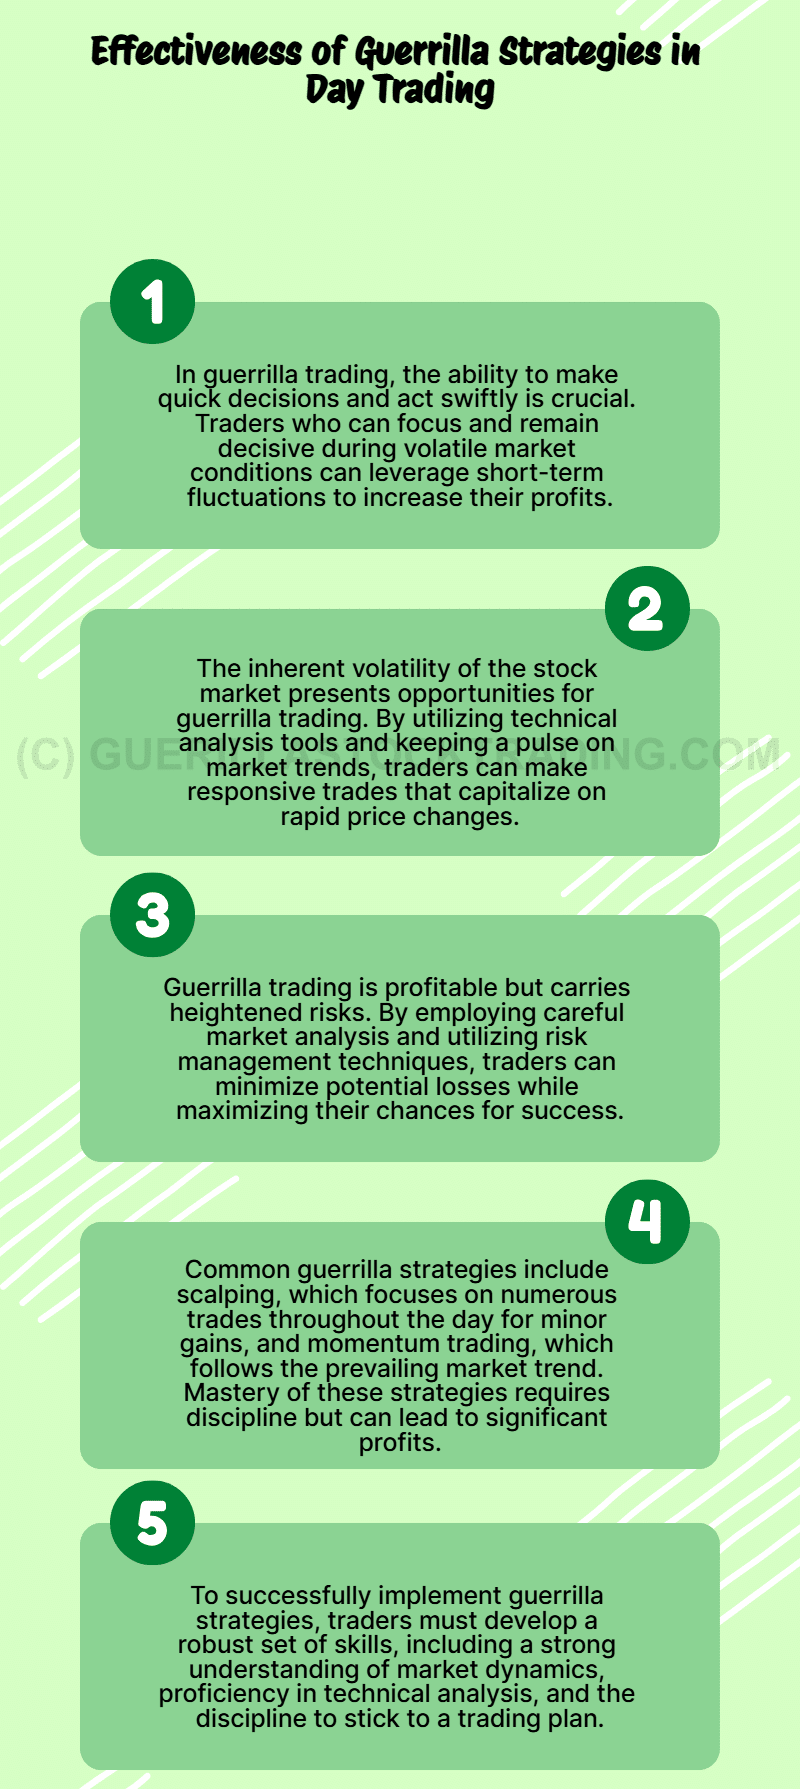
The essence of guerrilla trading lies in its focus on speed. Traders must be highly alert, focused, and capable of making split-second decisions. This agility allows them to take advantage of fleeting opportunities in the market, where even a few seconds can make a significant difference. For traders who thrive in high-pressure environments, guerrilla strategies provide the tools to excel.
Capitalizing on Volatility
The inherent volatility of the stock market creates frequent opportunities for guerrilla traders. Prices fluctuate rapidly throughout the trading day, offering multiple entry and exit points. By leveraging technical analysis tools and monitoring market trends, traders can identify short-term patterns and capitalize on them effectively. This approach ensures that volatility becomes an advantage rather than a challenge.
Minimizing Risk
While guerrilla trading involves higher risk due to its fast-paced nature, it also includes strategies to mitigate potential losses. Effective risk management is a cornerstone of this approach. By conducting thorough market analysis and using tools such as stop-loss orders, traders can minimize exposure to adverse market movements. This disciplined approach helps balance the risk-reward ratio.
Examples of Guerrilla Trading Strategies
Several popular strategies form the backbone of guerrilla trading. These methods are designed to suit the high-speed nature of the approach:
Scalping
Scalping is a cornerstone strategy in guerrilla trading. It involves making multiple trades throughout the day, each targeting small price movements. This strategy requires discipline and a keen eye for detail, as profits are derived from frequent, incremental gains. Scalpers rely heavily on technical analysis and low-latency trading tools to execute trades quickly.
Momentum Trading
Momentum trading aligns with the prevailing market trend, allowing traders to ride the wave of price movements. This strategy is particularly effective in markets with strong directional trends. By identifying assets experiencing significant momentum and trading in their direction, traders can maximize their profits while reducing the likelihood of counter-trend losses.
Guerrilla trading strategies are not only valuable for short-term traders but also offer insights for investors seeking to understand market dynamics. They highlight the importance of timing, discipline, and technical analysis in achieving financial goals. For investors, understanding these strategies can provide a deeper appreciation of how short-term market movements influence long-term trends.
Incorporating guerrilla strategies into day trading empowers traders to achieve quick gains while navigating the complexities of volatile markets. By emphasizing speed, capitalizing on volatility, and employing robust risk management practices, traders can improve their chances of success. Popular approaches such as scalping and momentum trading demonstrate the versatility and potential of guerrilla strategies when executed with discipline and focus. With careful preparation and a solid trading plan, traders can leverage these techniques to reach their financial objectives and thrive in dynamic market conditions.
Mastering Entry and Exit Points in Guerrilla Trading
Guerrilla trading, a fast-paced and high-risk style of day trading, thrives on precise timing. Identifying optimal entry and exit points is at the heart of this approach, enabling traders to seize quick gains by leveraging overlooked opportunities. By integrating strategic tools and analysis, guerrilla traders can enhance their success in volatile markets.
Understanding Entry and Exit Points in Guerrilla Trading
The ability to pinpoint entry and exit points is essential for day traders, especially those adopting guerrilla trading strategies. These decisions often rely on technical indicators, support and resistance levels, market volume, and timely news events. Combining these tools creates a robust framework for executing trades with precision.
Key Strategies for Identifying Entry and Exit Points
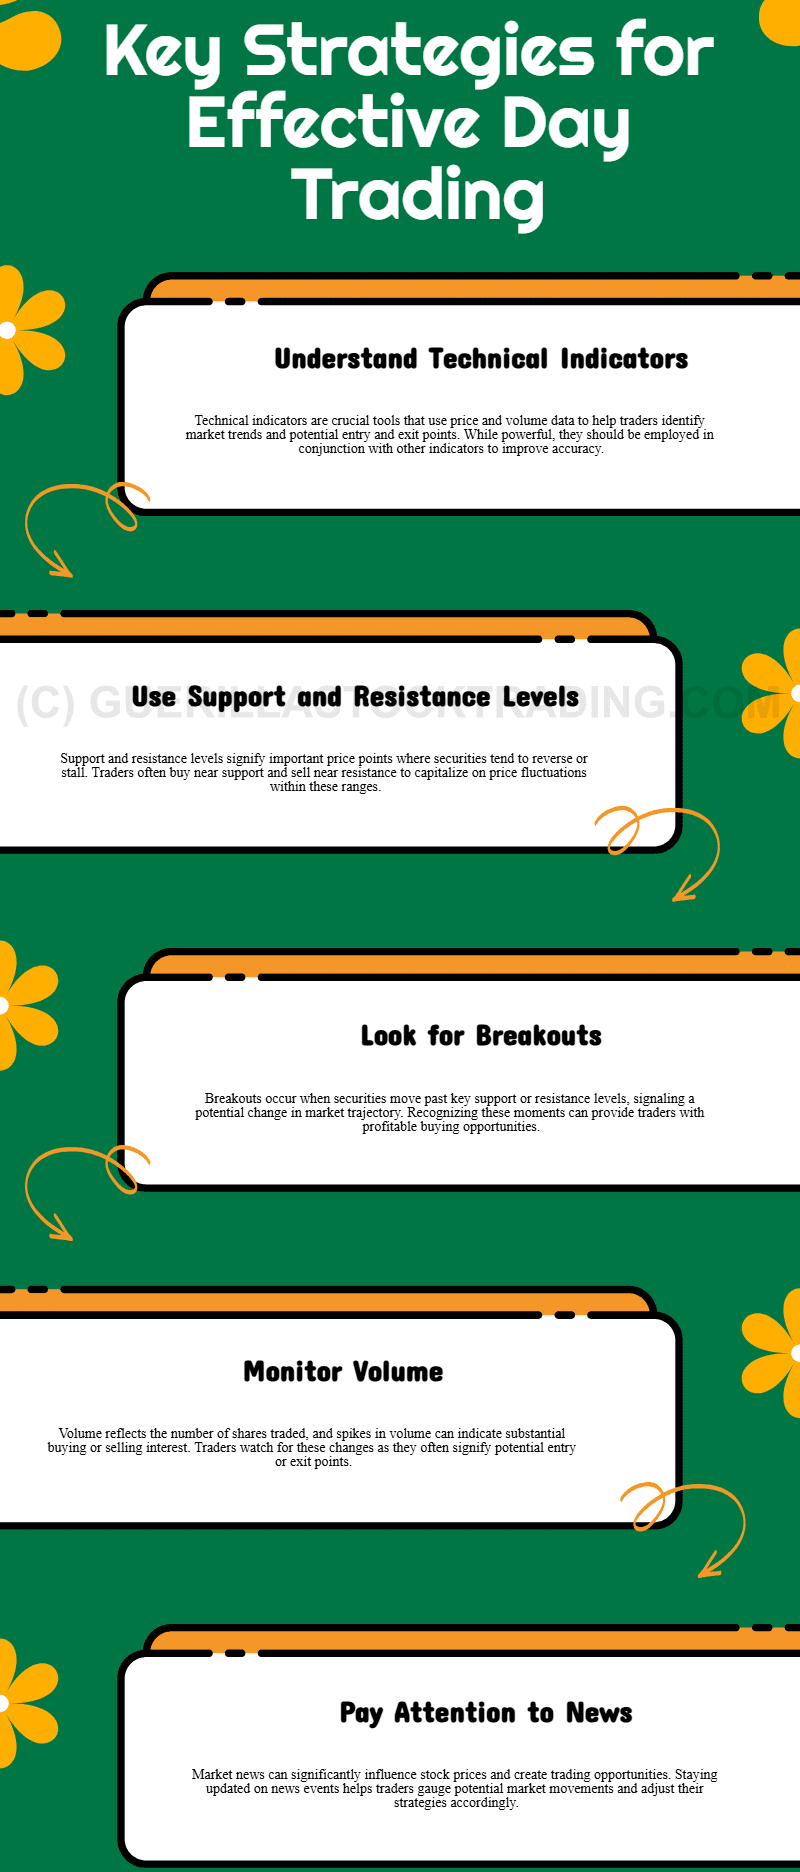
Using Technical Indicators
Technical indicators serve as a foundation for analyzing market trends, momentum, and potential trade opportunities. Indicators such as moving averagesThe concept of moving averages dates back to the early 20th century. While it is challenging to attribute the invention of moving averages to a single individual, W. P. Hamilton, a…, RSIIn the world of technical analysis, the Relative Strength Index (RSI) stands as a cornerstone tool for traders seeking insights into market momentum. Developed by J. Welles Wilder … (Relative Strength IndexIn the world of technical analysis, the Relative Strength Index (RSI) stands as a cornerstone tool for traders seeking insights into market momentum. Developed by J. Welles Wilder …), and MACDThe MACD indicator is essentially a momentum indicator that shows the relationship between two different moving averages of price. The MACD is the difference between the 12-period … (Moving AverageThe concept of moving averages dates back to the early 20th century. While it is challenging to attribute the invention of moving averages to a single individual, W. P. Hamilton, a… Convergence Divergence) can reveal key market dynamics. However, traders should avoid relying on a single indicator. Instead, combining multiple tools provides a clearer and more reliable picture of potential entry and exit points.
Leveraging Support and Resistance Levels
Support and resistance levels are critical in identifying price zones where securities historically face buying or selling pressure. For example, if a stock consistently trades between $50 and $60, these levels can guide trading decisions. A trader might buy near $50, anticipating a rebound, and sell near $60 to capitalize on price resistance.
Spotting Breakouts
Breakouts occur when a security moves beyond established support or resistance levels, often signaling a shift in market dynamics. For instance, if a stock breaks above a $60 resistance level, it may indicate the start of an uptrend, presenting a buying opportunity. Similarly, a breakoutBreakout patterns occur when a stock price moves beyond a defined level of support or resistance with increased volume, signaling the potential start of a new trend. A breakout ind… below support could signal a short-selling opportunity.
Monitoring Volume
Volume reflects the intensity of market activity, offering insights into buying or selling pressure. A sudden spike in volume often precedes significant price movements. For example, increased volume during a breakoutBreakout patterns occur when a stock price moves beyond a defined level of support or resistance with increased volume, signaling the potential start of a new trend. A breakout ind… reinforces the likelihood of sustained momentum, providing traders with an actionable signal.
Staying Updated on News
Market-moving news events, such as earnings announcements or regulatory updates, can create short-term opportunities. Positive earnings results, for instance, might drive a stock’s price higher, while negative news could trigger a sell-off. Staying informed allows traders to react swiftly and align their strategies with market sentiment.
For guerrilla traders, mastering entry and exit points is crucial for navigating the rapid pace of day trading. These strategies also hold value for investors who may not engage in high-frequency trading. Understanding technical indicators, market trends, and the impact of news events provides a broader perspective on market dynamics. This knowledge can inform both short-term trading decisions and long-term investment strategies.
Leveraging Chart Pattern Analysis in Guerrilla Trading Strategies
Trading is all about making precise decisions to capitalize on market movements. For guerrilla traders—those aiming to make quick and informed trades—chart pattern analysis is a powerful tool. This technique involves identifying patterns in stock charts to uncover potential trading opportunities. By mastering chart patternsChart patterns are visual formations on price charts that occur due to the behavior of buyers and sellers in the market. These patterns often signal potential future price movement…, guerrilla traders can enhance their ability to spot trends, determine entry and exit points, and ultimately maximize their profits.
Why Chart Patterns Are Essential for Guerrilla Trading
Chart patternChart patterns are visual formations on price charts that occur due to the behavior of buyers and sellers in the market. These patterns often signal potential future price movement… analysis allows traders to interpret market behavior through visual cues, offering actionable insights that can guide trading decisions. Here’s how this approach benefits guerrilla traders:
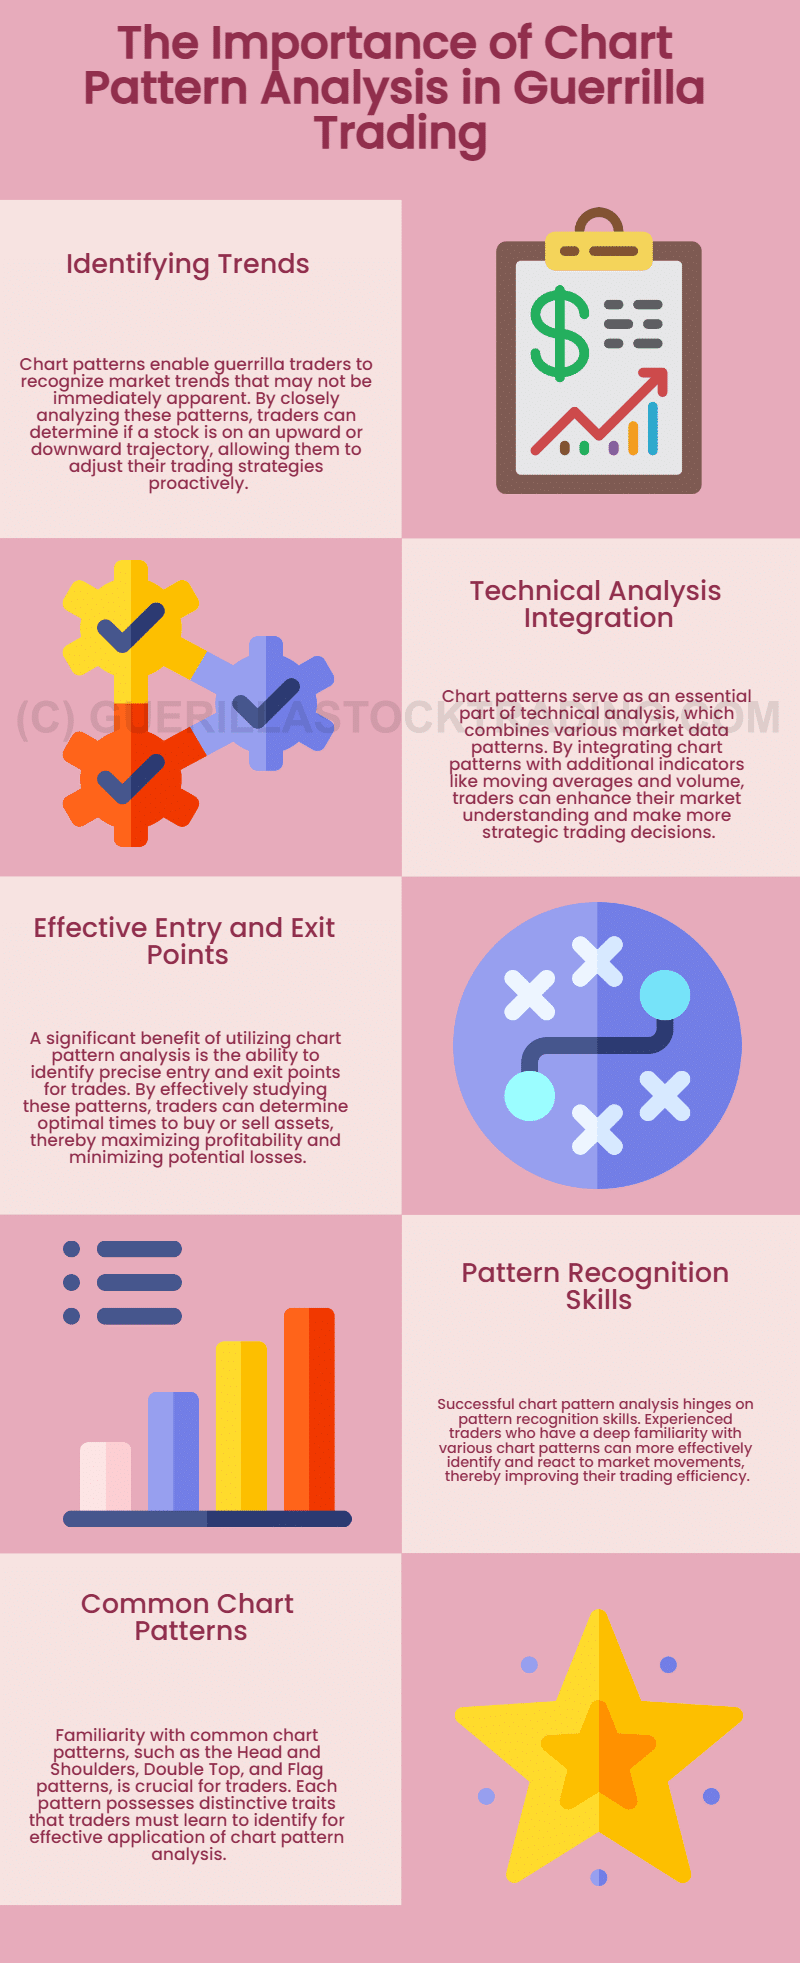
Identifying Trends
Chart patternsChart patterns are visual formations on price charts that occur due to the behavior of buyers and sellers in the market. These patterns often signal potential future price movement… help guerrilla traders identify market trends that might otherwise go unnoticed. By recognizing patterns that signal an upward or downward trajectory, traders can adjust their strategies to align with prevailing market conditions. For instance, spotting a bullish pattern could prompt a trader to enter a long position, while a bearish pattern might indicate the need to short the stock.
Enhancing Technical Analysis
Chart patternsChart patterns are visual formations on price charts that occur due to the behavior of buyers and sellers in the market. These patterns often signal potential future price movement… are a cornerstone of technical analysis, which involves examining market data to predict future price movements. When combined with other indicators, such as moving averagesThe concept of moving averages dates back to the early 20th century. While it is challenging to attribute the invention of moving averages to a single individual, W. P. Hamilton, a… and volume trends, chart patternsChart patterns are visual formations on price charts that occur due to the behavior of buyers and sellers in the market. These patterns often signal potential future price movement… provide a comprehensive view of the market. This synergy enables traders to make well-informed decisions and minimize risks.
Pinpointing Entry and Exit Points
One of the most significant advantages of chart patternChart patterns are visual formations on price charts that occur due to the behavior of buyers and sellers in the market. These patterns often signal potential future price movement… analysis is its ability to identify precise entry and exit points. For guerrilla traders, timing is critical. By studying patterns, such as breakouts or reversals, traders can determine the optimal moments to buy or sell, maximizing gains and limiting losses.
Mastering Pattern Recognition
Effective chart patternChart patterns are visual formations on price charts that occur due to the behavior of buyers and sellers in the market. These patterns often signal potential future price movement… analysis requires the ability to recognize recurring patterns. This skill develops with experience and practice. The more familiar traders are with patterns like Head and ShouldersThe head and shoulders chart pattern is a technical analysis tool used in stock trading. It is one of the most well-known and widely recognized chart patterns, and it is used by in…, Double Tops, or Flags, the better equipped they are to apply this strategy effectively. Pattern recognition transforms raw chart data into actionable insights.
Common Chart Patterns
Some widely recognized patterns include:
- Head and ShouldersThe head and shoulders chart pattern is a technical analysis tool used in stock trading. It is one of the most well-known and widely recognized chart patterns, and it is used by in…: Often signals a reversal in an uptrend, indicating a potential bearish move.
- Double TopThe double top chart patterns occur when the price of a security makes two successive highs, with a valley in between, before the price begins to decline again.: Suggests a bearish reversal after a stock fails to break resistance twice.
- Flag Pattern: Represents a continuation pattern that often signals the resumption of the prevailing trend.
Each pattern has distinct characteristics, and understanding them is crucial for effective trading.
While guerrilla traders benefit most from the quick insights provided by chart patternChart patterns are visual formations on price charts that occur due to the behavior of buyers and sellers in the market. These patterns often signal potential future price movement… analysis, long-term investors can also find value in this approach. Recognizing patterns helps investors understand broader market trends and make strategic decisions about their portfolios. For example, a Head and ShouldersThe head and shoulders chart pattern is a technical analysis tool used in stock trading. It is one of the most well-known and widely recognized chart patterns, and it is used by in… pattern on a major index could indicate a market-wide trend shift, impacting long-term investments.
Chart patternChart patterns are visual formations on price charts that occur due to the behavior of buyers and sellers in the market. These patterns often signal potential future price movement… analysis is an indispensable tool for guerrilla traders seeking to navigate fast-paced markets. By leveraging patterns to identify trends, analyze data, determine entry and exit points, and recognize recurring opportunities, traders can gain a significant edge. Although mastering this strategy requires expertise and practice, its potential for uncovering profitable trades makes it invaluable. Whether used independently or in conjunction with other technical indicators, chart patternChart patterns are visual formations on price charts that occur due to the behavior of buyers and sellers in the market. These patterns often signal potential future price movement… analysis equips traders to make informed, precise, and timely decisions.
The Future of Risk Management in Guerrilla Trading
As financial markets grow increasingly dynamic, the importance of risk management in trading has reached new heights. In guerrilla trading—a high-intensity, fast-paced trading style—effective risk management is not just a necessity but a cornerstone for success. Industry experts, traders, and investors are closely analyzing the evolving landscape of risk management, identifying key trends and future strategies.
Why Risk Management Is Crucial in Guerrilla Trading
Risk management in guerrilla trading is essential to minimize losses and sustain profitability in a volatile and high-stakes environment. Effective strategies allow traders to navigate market uncertainties with greater confidence. For investors, understanding these practices sheds light on how top traders maintain resilience and achieve success in rapidly shifting financial markets.
1. Automation: The Game Changer
Automation is poised to revolutionize risk management in guerrilla trading. Leveraging artificial intelligence (AI) and machine learning, traders can automate critical risk management processes. Advanced algorithms monitor market conditions, assess volatility, and execute trades when pre-set conditions are met, ensuring real-time responses to potential risks.
For example, an automated system can analyze price fluctuations and initiate trade adjustments when volatility exceeds defined thresholds. This not only enhances efficiency but also eliminates emotional decision-making. For investors, the integration of AI highlights the increasing role of technology in driving precision and reducing human error in financial markets.
2. Harnessing Big Data
The use of big data analytics is transforming the way traders identify and mitigate risks. By processing vast amounts of information from multiple sources, big data tools reveal patterns and trends invisible to the human eye. These insights enable traders to make informed decisions based on comprehensive market analysis.
For instance, analyzing social media sentiment or news events through big data tools can help predict market movements and their potential impacts. Investors should pay attention to this trend as it underscores the value of data-driven decision-making in achieving sustainable trading outcomes.
3. Scenario Analysis: Preparing for Uncertainty
Scenario analysis is becoming a vital tool for traders to anticipate potential risks and opportunities. This technique involves simulating various hypothetical market scenarios to understand how different factors, such as interest rate changes or geopolitical events, might affect trading strategies.
By using scenario analysis, traders can develop contingency plans for a range of market conditions. For example, they might simulate the effects of sudden interest rate hikes to gauge their portfolio’s resilience. For investors, this practice highlights the importance of proactive planning in managing financial uncertainty.
4. Diversification: A Timeless Strategy
Diversification remains a fundamental risk management strategy in guerrilla trading. By spreading investments across multiple asset classes, traders can mitigate the impact of adverse market movements on their overall portfolio.
For example, a trader might allocate funds across stocks, bondsUnited States Treasury securities are debt instruments issued by the United States government to finance its spending. Treasury securities come in a variety of forms, including bil…, and commodities to reduce reliance on any single market. This approach minimizes exposure to concentrated risks while ensuring broader opportunities for growth. For investors, diversification underscores the timeless principle of spreading risk to achieve stability and long-term returns.
Key Takeaways for Investors
The future of risk management in guerrilla trading is rapidly evolving, driven by technological advancements and innovative strategies. Automation, big data analytics, scenario analysis, and diversification are reshaping how traders approach risk in a complex financial landscape.
For investors, understanding these trends is crucial. They highlight the need for adaptability, precision, and resilience in navigating modern markets. Traders who embrace these innovations are better equipped to manage uncertainties, capitalize on opportunities, and deliver consistent performance. In an era of rapid financial change, effective risk management remains the cornerstone of sustainable success.
💯 Popular Trading Lessons To Beat the Competition
Trading and Investment Ideas:
Source link