Break and Retest Strategy in Trading Explained
The break and retest strategy is a trading approach based on support and resistance levels. A breakout occurs when price moves beyond a key level, while a retest happens when price returns to that level before potentially continuing in the direction of the breakout. Traders use this strategy in forex and CFD markets to identify possible trend continuation setups and evaluate market structure shifts.
The approach is commonly applied in trending conditions, where price momentum may support continuation after the retest is confirmed. Traders often combine break and retest in trading with price action analysis, volume, or technical indicators to assess breakout strength and manage risk more effectively. In this article, we explain how the break and retest strategy works, how traders may apply it in different market conditions, and which confirmation methods are commonly used.
Break and Retest Strategy Explained
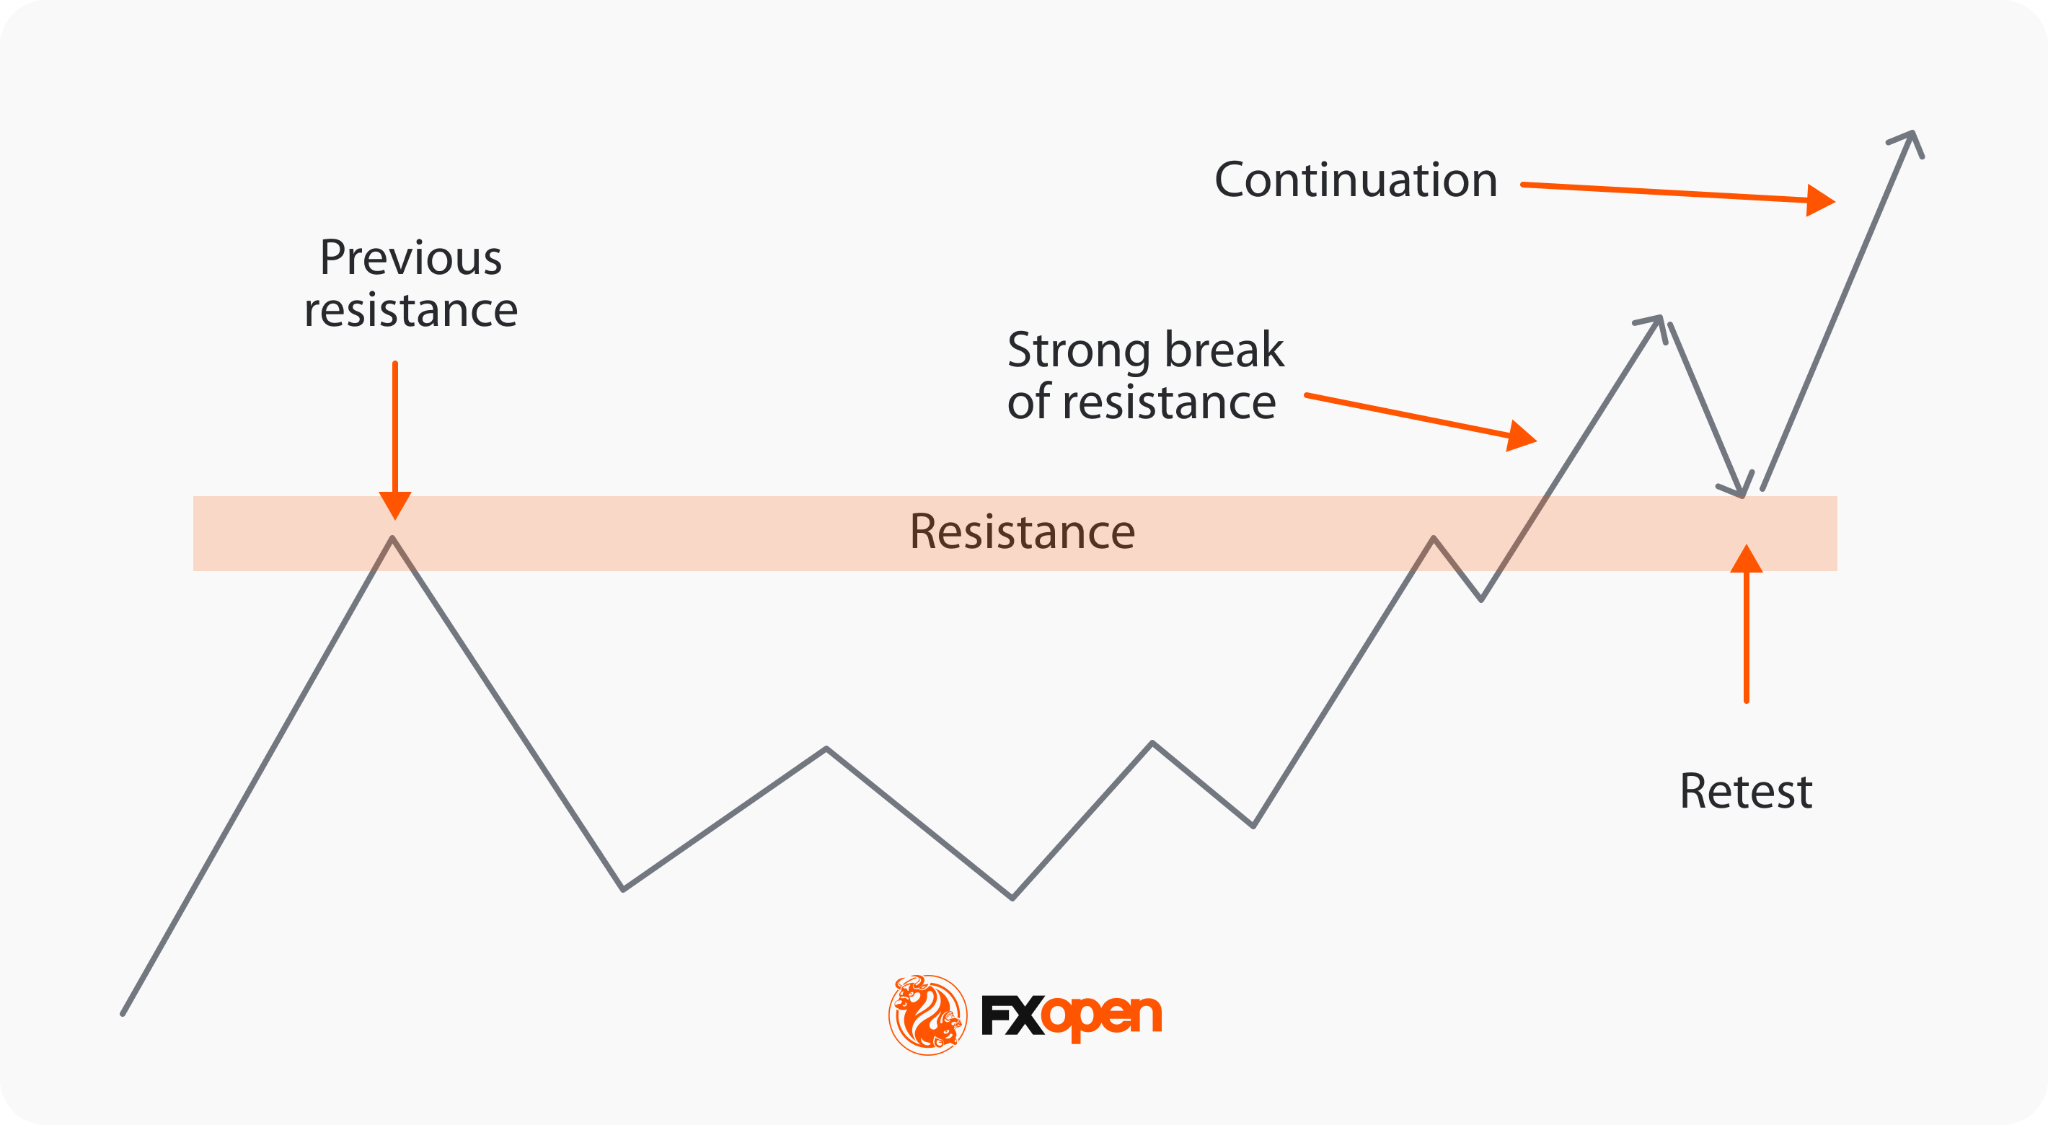
The break and retest strategy involves three stages. Price first breaks a major support or resistance level. It then returns to retest that level. Finally, the trend continues in the breakout direction. Each stage builds on the previous, with the retest giving traders a second reference point.
The breakout itself is a liquidity shift. Resting orders above resistance and below support get absorbed when price moves through. New positions then build in the breakout direction. The retest acts as validation: the level either holds in its new role or fails.
A support/resistance retest works on role reversal. Broken resistance often acts as support on the return move. Broken support often acts as resistance. When the retest holds and price moves away from the level, the original signal is confirmed. The trend tends to continue from that point.
Break and Retest Strategy Steps
The break and retest strategy follows a fixed sequence. Each step builds on the last, with execution clarity around entries, stops, and invalidation.
1. Identifying Key Levels
Traders mark significant support and resistance levels on the chart. Levels validated by multiple touches and clear reactions carry more weight than untested ones.
2. Monitoring for a Breakout
A breakout occurs when price closes decisively beyond a key level, often with rising trading volume. A volume surge supports the move and reduces the chance of a false break.
3. Waiting for the Retest
After the breakout, price often retraces to test the broken level. Former resistance now acts as support, or former support as resistance, depending on direction.
4. Confirming the Retest
Confirmation comes from price action at the retest. Rejection candles such as pin bars or engulfing patterns, paired with sustained volume, suggest the new level is holding.
5. Entering the Trade
Traders typically enter once the rejection candle closes.
6. Managing the Trade
Traders could set take-profit levels at prior swing points or fixed risk-reward ratios. Stop-loss orders could sit beyond the retest extreme: below the new support for longs, above the new resistance for shorts. They also may be trailed to protect unrealised gains as price moves favourably.
Entry and Exit Logic
A break and retest entry strategy needs a defined trigger. The most common is a candle close in the breakout direction after the retest, often with a rejection wick at the level. Aggressive traders typically enter on the close of the rejection candle itself. More conservative traders typically wait for the next candles to confirm direction before committing.
Stop placement follows the structure. For longs, stops typically sit a few pips below the retest low or below the most recent swing point. For shorts, stops sit above the retest high or below the most recent swing high. Position sizing then scales to the stop distance rather than the other way around. This anchors risk management to where the trade idea is invalidated, not to an arbitrary pip figure.
Take-profit targets are commonly set at the next significant structural level, or at a fixed risk-reward ratio such as 1:2 or 1:3.
Break and Retest Trading Example (Forex)
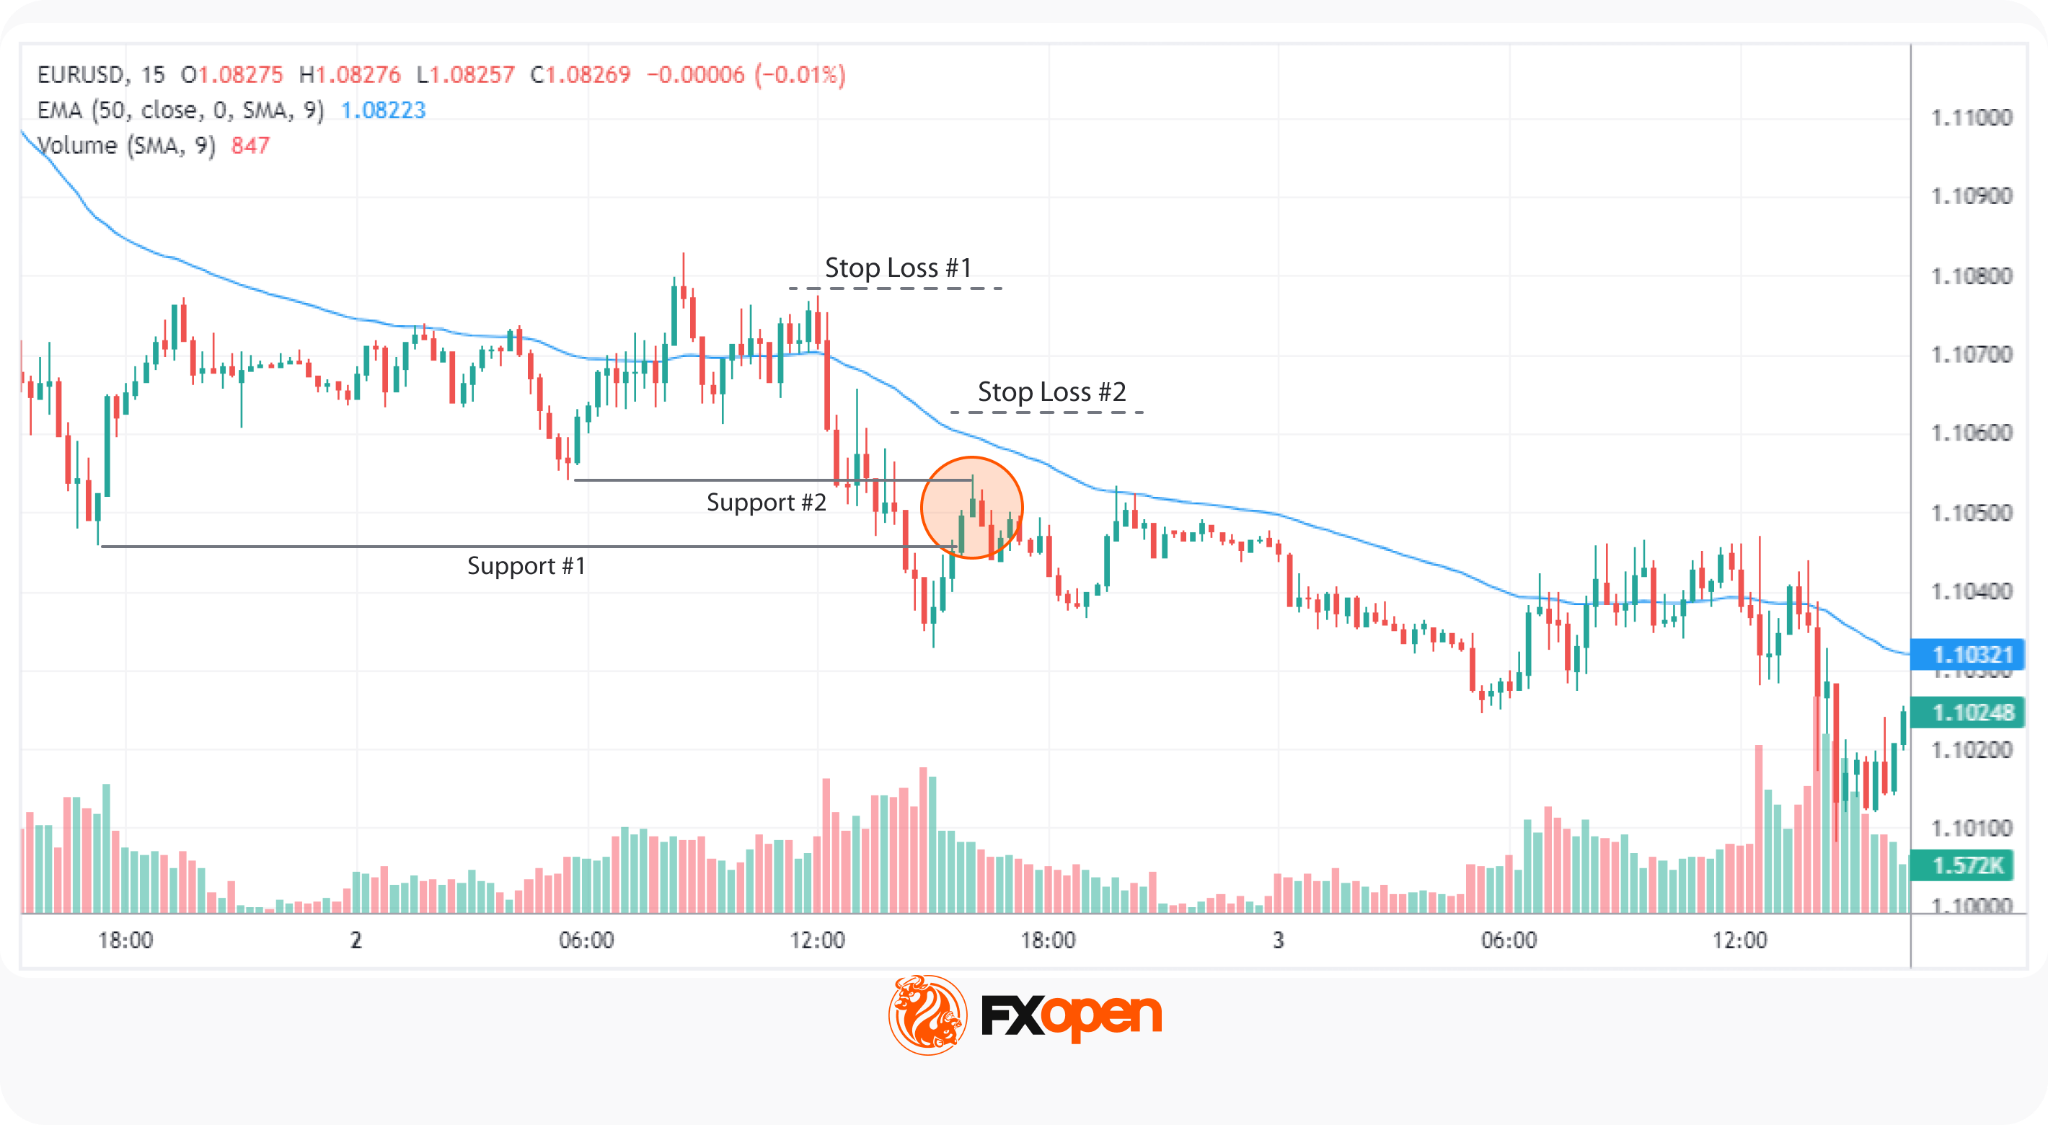
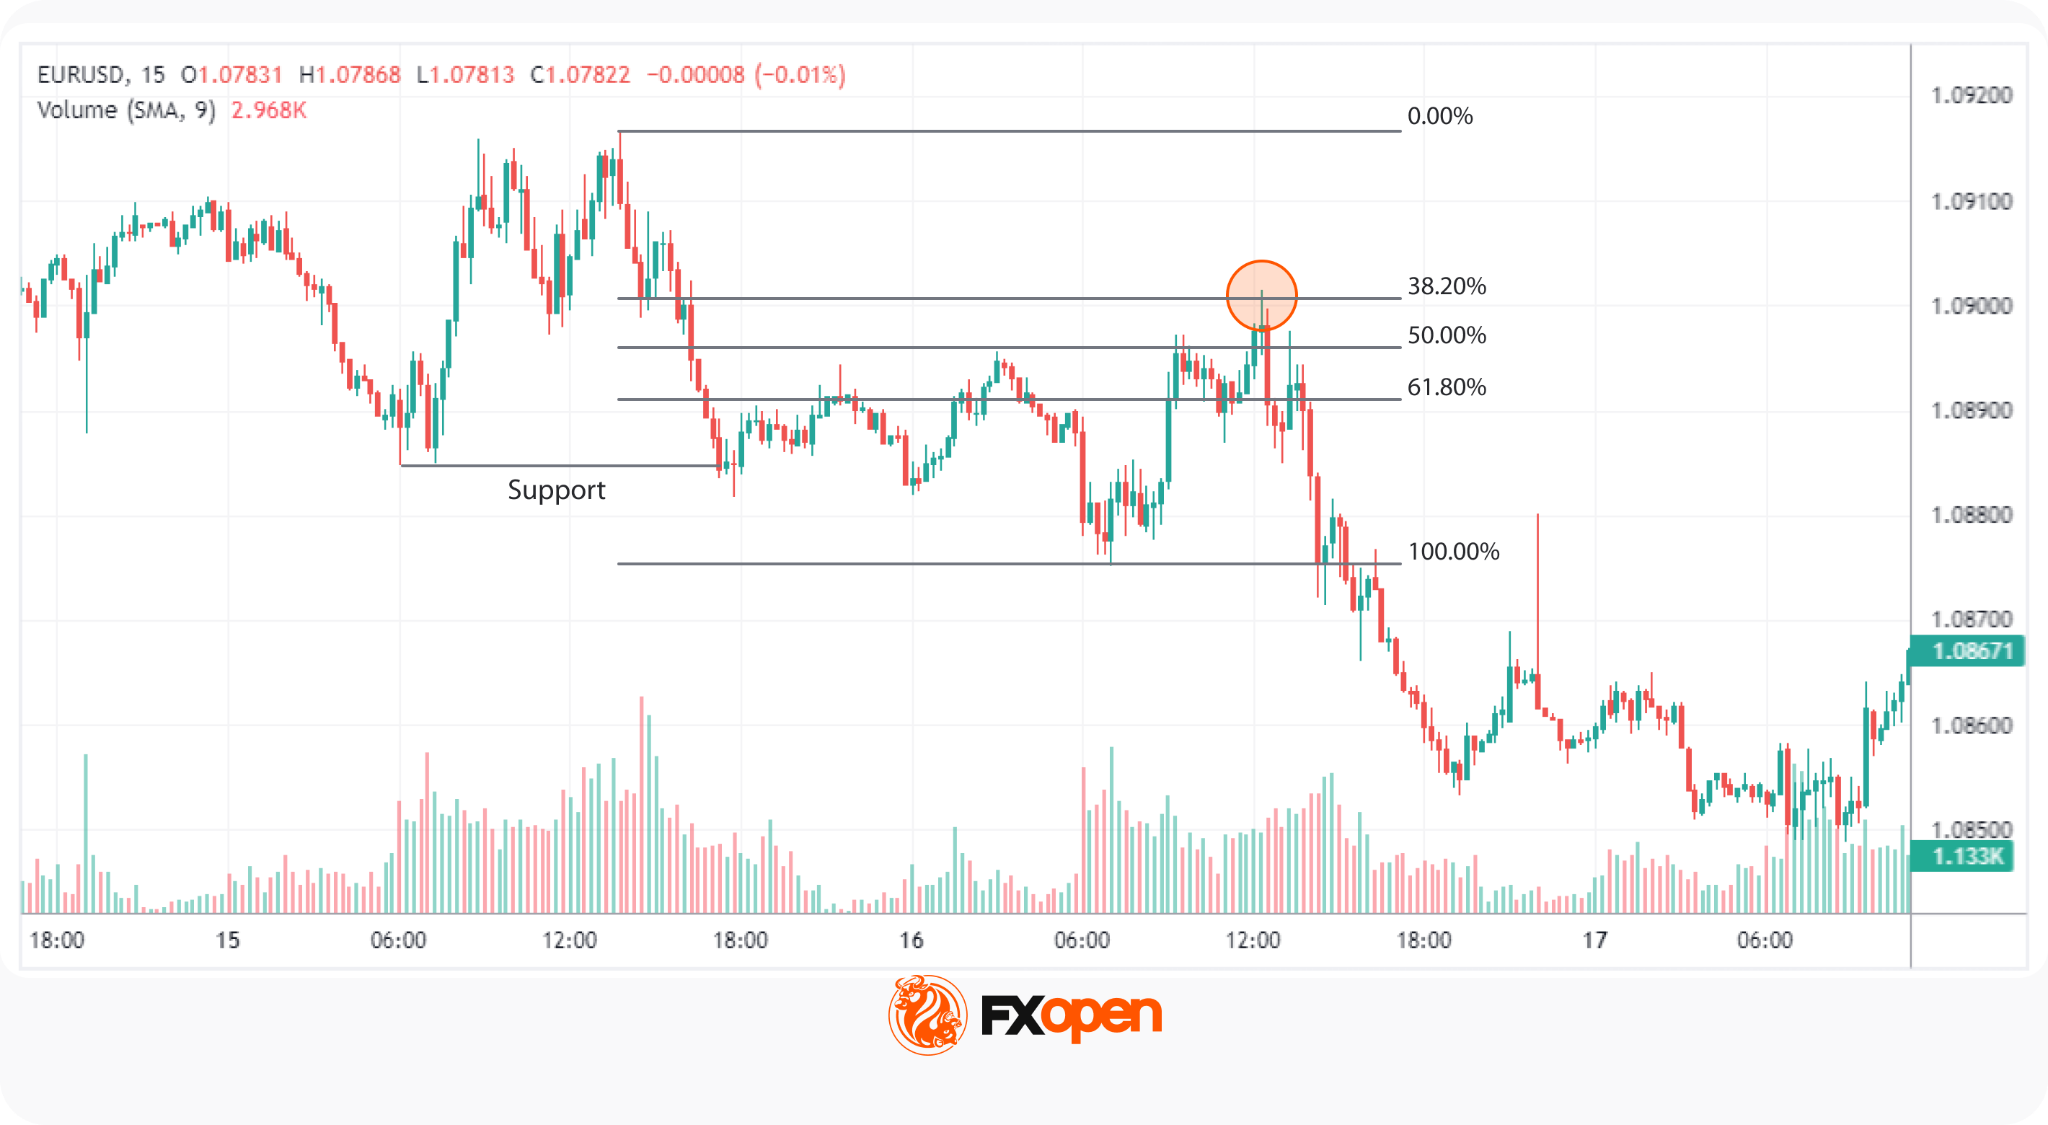
Consider this EUR/USD 15-minute chart, which displays a clear bearish trend. The 50-period Exponential Moving Average (EMA) slopes downward, acting as dynamic resistance with price staying below it. Recently, the price broke below a key support level on higher-than-average volume, signalling the time to apply the break and retest strategy.
Two support levels are worth monitoring. The first sits at the broader structural low. Trading at this level can allow traders to enter the market quickly, though it comes with a less favourable risk-reward ratio.
The second support level is found within the recent brief retracement. This level offers an entry with a tighter stop, improving the risk-reward profile. The trade-off is that price may not retrace deeply enough, leaving traders without a fill.
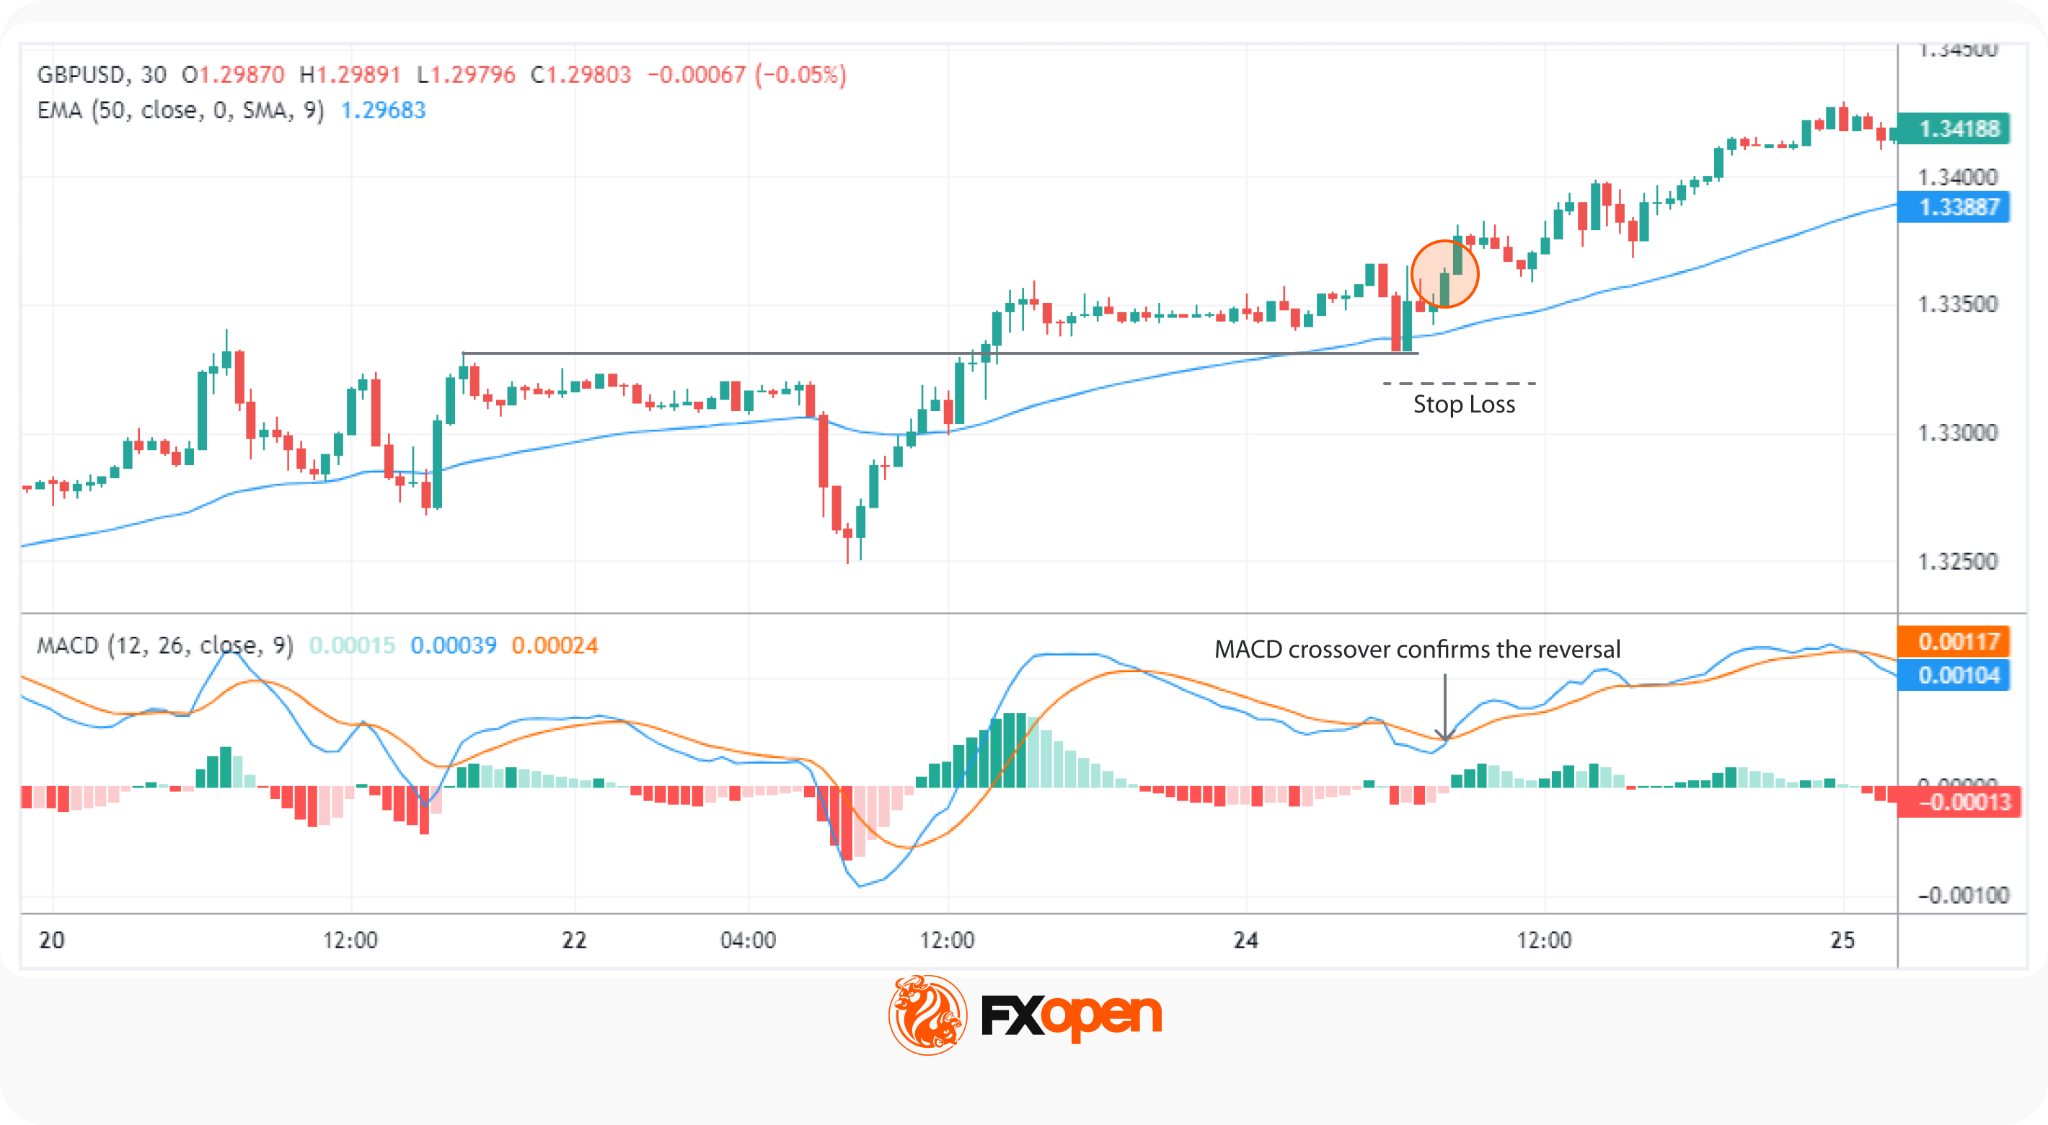
The entry point is identified by a candle with a wick longer than its body (a pin-bar on the 30m chart), indicating rejection of higher prices as the market retests the second support level. Once this candle closes, traders typically enter at the next candle.
Stop losses would typically be placed either above the last major swing high or the 50-period EMA, depending on individual risk tolerance. Take-profit targets are commonly set at a 1:3 risk/reward ratio, where every pip risked targets three pips of potential return. An alternative is the next significant support level below, where price reaction may develop.
Alternative Entry Scenarios
Not every retest develops the same way. A shallow retest pulls back only marginally before resuming the trend, often leaving conservative traders without a fill. An aggressive entry on the first rejection candle captures these moves but accepts wider initial drawdown risk.
A deep retest pulls back further into the previous range, sometimes to the 50% or 61.8% Fibonacci level of the breakout swing. These setups could offer tighter stops and a stronger risk-reward profile, though they carry a higher chance of the level failing entirely. Ultimately, missed trades are a cost of waiting for confirmation in a breakout trading strategy.
Confirmation Methods in Break and Retest Trading
Price action remains the primary confirmation tool. A rejection candle at the retest level carries more weight than any indicator reading on its own. Indicators, multi-timeframe analysis, Fibonacci levels, and fundamentals are layered on top of that price-action signal rather than used in isolation.
Retest trading confirmation signals gain reliability when two or more methods align around the same level. Conflicting signals are themselves information, often pointing to a setup worth skipping. Here are several methods traders consider:
1. Indicators
The RSI and MACD are two common break and retest indicators. An RSI crossing below 70 or above 30 during a breakout suggests weakening upside/downside momentum. An MACD line crossing above/below its signal line, or the histogram rising/falling above zero, suggests strengthening bullish/bearish momentum.
2. Multi-Timeframe Analysis
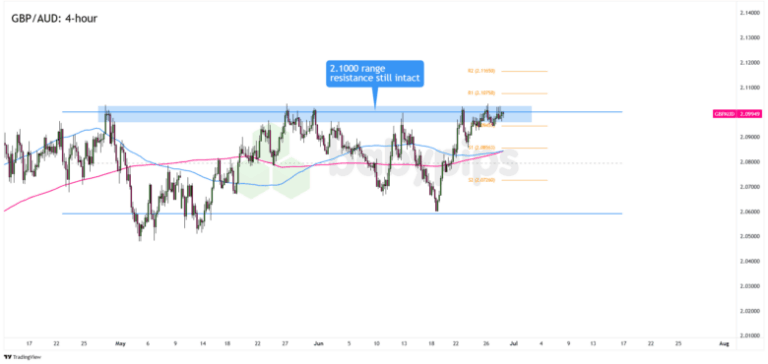
Multi-timeframe analysis works top-down. The higher timeframe (HTF) sets the directional bias, the lower timeframe (LTF) refines entry timing. A breakout observed on a 4-hour chart gains additional confirmation when a strong trend is also visible on a daily chart. Alignment across timeframes filters out lower-timeframe noise.
3. Fibonacci Retracements
The Fibonacci retracement tool is drawn from the breakout swing high to the breakout swing low (or vice versa for bullish setups). The 38.2%, 50%, and 61.8% levels are the most-watched retest zones. According to theory, a retest that holds at one of these levels carries stronger structural support than a retest at an arbitrary price.
4. Fundamental Analysis
Fundamentals tie technical setups to real volatility drivers. A breakout aligned with a major economic release or central bank decision is more likely to sustain than one occurring in low-volume conditions. Traders typically cross-check an economic calendar for scheduled events around the retest window.
When Break and Retest Conditions Are Valid
Recognising when conditions favour the strategy is as important as the entry mechanics.
Trending markets may produce clearer break and retest setups because a directional bias can support continuation after the breakout. Range-bound or choppy markets generate frequent false breaks, with price flipping back through levels without commitment.
Volatility expansion may support breakout validity. A move accompanied by widening range and rising volume suggests participation behind the price action. A breakout on flat volume often lacks the order flow to sustain.
Session timing may also influence a forex breakout strategy. The London and New York sessions account for a large share of daily forex turnover, while their overlap is often associated with higher liquidity and volatility. As a result, some traders monitor breakouts forming during these periods more closely than those developing in quieter market conditions, where price expansion may be less consistent.
Advantages of the Break and Retest Strategy
The break and retest strategy has several advantages that make it one of the most popular trading approaches:
- Additional Confirmation: The retest serves as an additional validation of the breakout, boosting trader confidence in their entry decision and reducing hesitation.
- Strong Risk Management: Setting stop-loss orders based on the retest level provides a clear risk boundary.
- Alignment with Market Trends: This strategy naturally aligns trades with the prevailing market trend. By trading in the direction of the breakout, traders can take advantage of sustained movements.
- Versatility Across Markets: The breakout and retest strategy can be applied to various financial instruments, including forex, stocks, and commodities. Its adaptability makes it a valuable tool in diverse trading environments.
- Scalability and Flexibility: This strategy can be adapted to different timeframes and trading styles, making it popular among both short-term and long-term traders seeking to implement a consistent approach.
Disadvantages of the Break and Retest Strategy
While the break and retest strategy can be a powerful tool, traders may face several challenges when implementing it:
- False Breakouts: Not every breakout leads to a sustained trend. Sometimes, the price moves beyond a support or resistance level only to reverse shortly after. Recognising these false signals is crucial to avoid entering trades that may quickly turn against expectations.
- Market Conditions: According to theory, this strategy is more popular in trending markets. In sideways or highly volatile environments, breakouts can be less reliable, making it harder to distinguish a strong price movement from random swings.
- Timing the Retest: Accurately determining when the price will retest the broken level can be challenging. Entering too early may expose traders to higher risk, while waiting too long might result in missed trades if the retest doesn’t occur as anticipated.
- Reliance on Confirmation Signals: While additional indicators like RSI or MACD can support the strategy, over-reliance on these tools can complicate decision-making. Traders balance multiple signals without becoming overwhelmed or confused.
- Emotional Discipline: Maintaining discipline during retests is critical. Traders might feel pressured to act quickly if the market moves unexpectedly, leading to impulsive decisions that deviate from their trading plan.
Common Mistakes in Break and Retest Trading
Several recurring mistakes may reduce the effectiveness of the strategy. Recognising them early may help traders manage risk more consistently.
- Early entry. Jumping in on the first touch of the level rather than waiting for a rejection candle leaves the trade exposed to a false breakout. The retest needs to confirm, not just occur.
- Ignoring higher timeframes. When traders ignore a higher-timeframe trend, it may turn valid setups into low-probability trades. A clean retest against the daily-chart direction often fails, even when the lower-timeframe structure looks textbook.
- Chasing breakouts is the opposite error. Entering well after the initial break, with price already extended, could give a poor risk-reward profile and a wider stop. The retest is expected to be the entry, not the breakout candle.
- Overusing indicators clutters the decision. Stacking RSI, MACD, Bollinger Bands, and Stochastics on the same chart produces conflicting signals more often than convergent ones. One or two confirmation tools layered on price action often are more popular than five.
The Bottom Line
This strategy provides a structured approach for trading on breakouts and retests. Understanding how the price may behave after a breakout may support traders in their future decisions. One of the major advantages of the break and retest strategy is that it can be applied across different markets and timeframes. However, traders should note that break and retest trading requires consideration of market conditions and careful risk management.
Traders looking to apply the strategy can consider opening a trading account at FXOpen and gain access to three advanced trading platforms, tight spreads, and low commissions from $1.50 per lot (additional fees may apply).
FAQ
What Is a Retest in Trading?
A retest occurs when the price returns to a broken support or resistance level after an initial breakout. It serves to confirm the strength of the breakout, which may help traders decide whether the new trend will continue or if the breakout was false.
What Is the Break and Retest Strategy?
The break and retest strategy involves identifying a breakout of a key support or resistance level and then waiting for the price to return to that level. Traders use this retest as a confirmation to enter the market, aiming to follow the new trend.
How Many Times Can I Backtest My Strategy?
Backtesting is typically done extensively across different market conditions and timeframes. According to theory, traders need to test a strategy on at least 100 trades to understand how it performs in various scenarios.
Does Retest Always Happen?
No, the retest does not always happen. While retests are common, they are not guaranteed. Traders often use additional confirmation signals and be prepared for both possibilities when applying the break and retest strategy.
Which Timeframe Is Used for Break and Retest Trading?
The break and retest strategy works across timeframes. Higher timeframes such as the 4-hour and daily charts may produce clearer break and retest setups, as price movements can appear less affected by short-term market noise. Lower timeframes may appeal to active traders but can generate more frequent false breaks and less stable retest behaviour.
What Confirms a Valid Retest?
A valid retest is confirmed by price action at the broken level. Rejection candles such as pin bars or engulfing patterns, sustained volume, and alignment with the higher-timeframe trend all add weight. Confirmation matters more than the speed of entry.
Is Break and Retest Suitable for Forex Trading?
Yes. The break and retest strategy is widely applied in forex due to clear support and resistance structure and high liquidity. Major pairs such as EUR/USD and GBP/USD produce frequent setups, particularly during London and New York session overlaps.
This article represents the opinion of the Companies operating under the FXOpen brand only. It is not to be construed as an offer, solicitation, or recommendation with respect to products and services provided by the Companies operating under the FXOpen brand, nor is it to be considered financial advice.
Source link