How to Calculate Planetary Alignments for Stock Market Trading: Step-by-Step Astro Trading Guide for Nifty – Bramesh’s Technical Analysis
🧭 1. Step One: Convert Planetary Positions into Data
Astro-traders first convert sky movement into numbers.
Each planet is tracked using:
- Zodiac sign position (0°–360° circle)
- Exact degree (e.g., 123.45°)
- Speed (degrees per day)
- Retrograde / direct motion
For example:
- Mars at 15° Aries = 15° in zodiac system
- Jupiter at 15° Cancer = 105° apart → aspect calculation begins
This is the foundation: astronomy → numeric coordinates
📐 2. Step Two: Calculate “Aspects” (Alignments)
Alignments are not vague — they are defined by angular distance.
Common aspect formulas:
🔵 Conjunction
- Angle difference: 0° ± orb (usually 6–10°)
- Meaning: planets together → intensity spike theory
🔴 Opposition
- Angle: 180° ± orb
- Meaning: tension, reversal zones
🟡 Square
- Angle: 90° ± orb
- Meaning: volatility / conflict
🟢 Trine
- Angle: 120° ± orb
- Meaning: smooth trend flow
Calculation formula:
Then check if:
Example:
- Mars = 100°
- Saturn = 190°
- Difference = 90° → Square → “high volatility zone”
📊 3. Step Three: Map Aspects to Time
This is where trading interpretation begins.
Astro-traders convert planetary events into time stamps, such as:
- Intraday (minute/hour alignment)
- Daily cycles
- Weekly turning points
Example logic:
- Mars–Mercury square active → expect sharp intraday swings
- Full moon ±1 day → volatility expansion window
So they build a time calendar of planetary events.
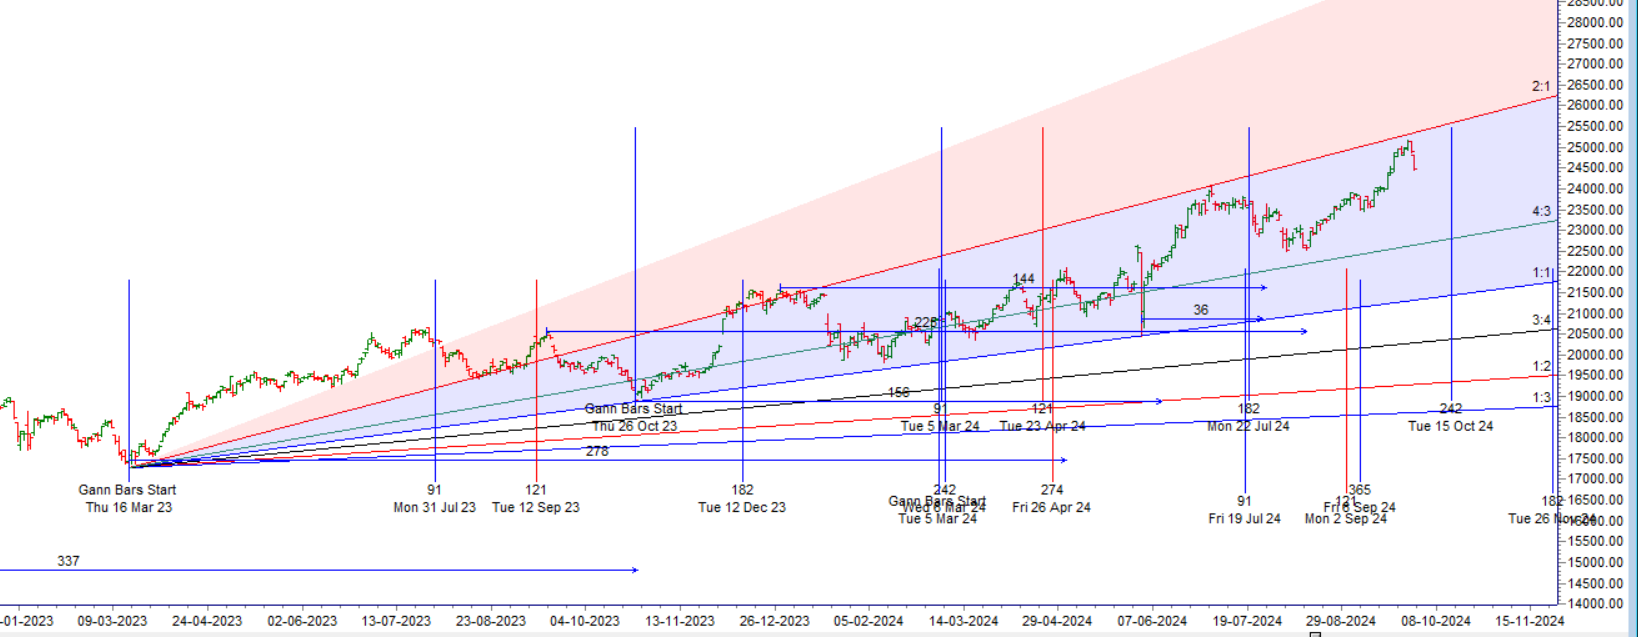
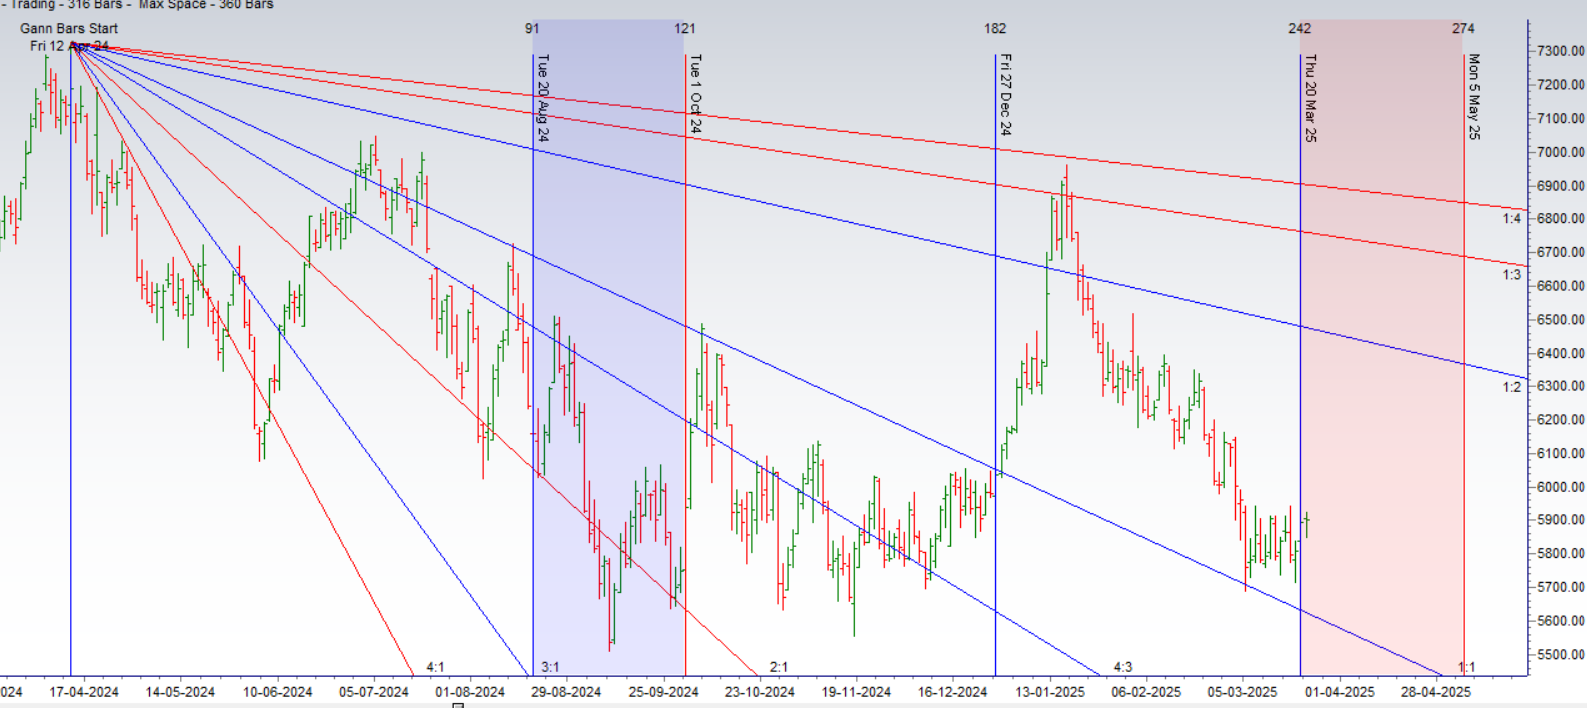
📈 4. Step Four: Overlay on Market Data
Now comes the trading test.
You overlay:
- Planetary event timestamps
with - Price data of Nifty 50
Then analyze:
- ATR (volatility spikes)
- Breakouts
- Reversals
- Gap openings
Example test:
🧪 5. Step Five: Backtesting (Most Important Step)
Serious astro-traders try to convert belief into statistics:
They test:
- Number of volatility spikes during specific alignments
- Average intraday range vs normal days
- Win rate of setups during astro windows
Example:
| Condition | Avg Nifty Range |
|---|---|
| Normal day | 120 points |
| Mars aspect day | 170 points |
This is where “astro claims” try to become quant-style hypotheses.
⚠️ 6. The Major Problem (Very Important)
Even if you do all the math correctly:
❌ No causal mechanism exists
Planets do not physically influence stock prices.
So any observed results can come from:
- Random clustering in price data
- Small sample bias
- Selective memory (only remembering “hits”)
- Curve fitting after the fact
This is why mainstream finance does NOT accept astro models.
🧠 7. How Traders Actually Use It in Real Life
Even believers do NOT trade purely on astrology.
They usually combine it with:
Core tools:
- Support/resistance
- Trend structure
- Volume & volatility (ATR)
- Options data (for Nifty)
Astro layer (optional filter):
- “High volatility day expected”
- “Reversal window active”
- “Low movement zone expected”
So astrology becomes:
a context filter, not a standalone trading system
📌 Final Practical Summary
To calculate planetary alignment impact on markets like Nifty 50, traders typically:
- Convert planets into degree positions
- Calculate angular differences (aspects)
- Convert aspects into time windows
- Overlay on price charts
- Backtest volatility and direction changes
- Compare results statistically
💡 Final Thought
Mathematically, astro-trading is:
A system of time-based pattern mapping layered on top of market data
But practically:
- The math is real
- The interpretation is subjective
- The predictive power is unproven
The real edge still comes from:
- Risk management
- Execution discipline
- Price action understanding
Not from the sky — but from how consistently you read what the market is actually doing on the screen.