Hyperliquid (HYPE) Price Prediction: Market Holds Key Support as Mixed Signals Shape Short-Term Outlook – Brave New Coin
The token, which powers the Hyperliquid Layer-1 ecosystem focused on perpetual futures and spot trading, is currently trading near $35.64, reflecting modest intraday gains and a largely balanced market structure.
Despite recent downward pressure, analysts suggest the asset is showing resilience compared to many altcoins, with technical indicators pointing to a market that is neither decisively bullish nor bearish.
HYPE Price Analysis: 0.382 Fibonacci and 4H 200 EMA Provide Support
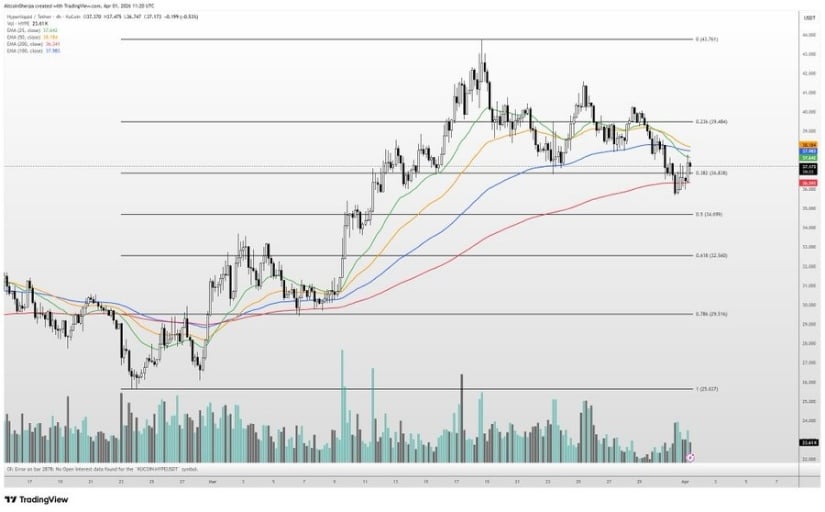
Market observers highlight that HYPE continues to hold above the 0.382 Fibonacci retracement level, reinforced by the 4-hour 200 EMA, both of which are acting as dynamic support zones. According to crypto analyst AltcoinSherpa, this positioning keeps the asset structurally intact despite recent price grinding.
HYPE remains supported at the 0.382 Fibonacci level and 4H 200 EMA, maintaining relative strength despite recent downside, though further movement is expected to depend on Bitcoin’s trend. Source: Altcoin Sherpa via X
He notes that Hyperliquid remains “one of the strongest altcoins” and describes it as a relative safe haven during choppy or downtrending conditions, though he also cautions that further downside cannot be ruled out given its correlation with Bitcoin’s broader trend.
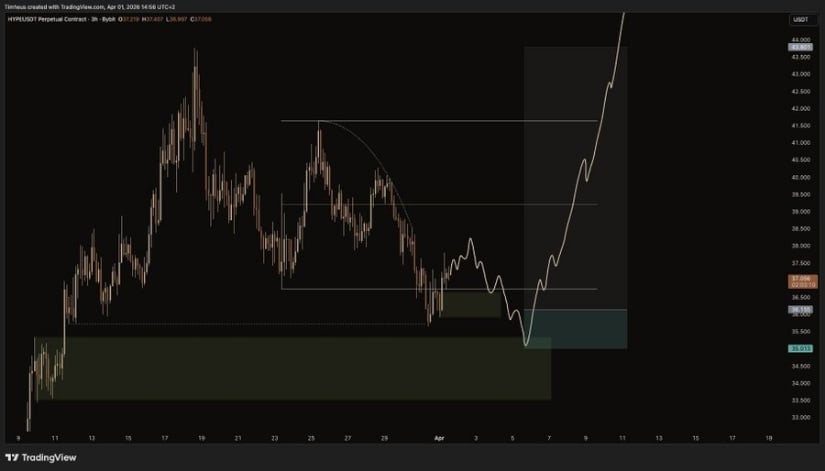
On higher timeframes, the asset appears to be forming a Wyckoff accumulation structure, with multiple demand zones identified between $35 and $36. Price recently rebounded from this region, suggesting that buyers are actively defending the area. More signs, like repeated touches on demand zones and signals from shorter timeframes, indicate that the price could move up if the buying strength continues.
Range-Bound Trading and Key Resistance Levels to Watch
While the longer-term structure shows signs of accumulation, shorter-term trading activity reflects a more cautious stance. Trader Mattertrades outlined a strategy involving layered sell orders near the $40 resistance zone, identifying it as a significant overhead supply area.
HYPE, the native token of the Hyperliquid Layer-1 blockchain for perpetual futures and spot trading, is showing a bullish higher-timeframe Wyckoff accumulation pattern. Source: Tim Heus via X
Recent price action shows HYPE declining toward $25.88 before recovering, establishing a broader trading range. Community discussions indicate that traders are closely watching $25.6 as support, while $33 to $38 represents a mid-to-upper resistance band.
This range-bound behavior highlights a market still searching for direction, with participants divided on whether price can reclaim higher levels in the near term.
Technical Indicators Show Neutral Bias with Balanced Momentum
Data from TradingView suggests that HYPEUSDT remains in a neutral zone, reflecting a near-even split between bullish and bearish signals. The Relative Strength Index (RSI) is positioned around 46, indicating neither overbought nor oversold conditions.
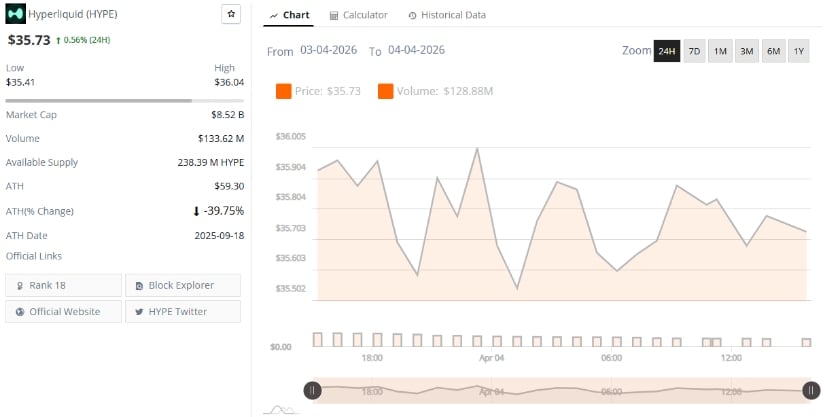
Hyperliquid was trading at around $35.73, up 0.56% in the last 24 hours at press time. Source: Brave New Coin
Momentum indicators present a mixed picture. Oscillators like the Stochastic %K, Commodity Channel Index, and Williams %R suggest a possible bounce back from being oversold, but the MACD and momentum indicators still show some ongoing weakness. Overall, the oscillator panel shows a slight tilt toward recovery but lacks strong conviction.
Moving averages further reinforce this equilibrium. Short-term averages remain bearish, placing pressure on price in the near term. However, longer-term averages, including the 50, 100, and 200-period EMAs and SMAs, have shifted bullish, suggesting that the broader trend is gradually stabilizing.
This balance between opposing signals underscores a market in transition, where confirmation of the next directional move is still pending.
Liquidity Zones and Smart Money Concepts Shape Price Structure
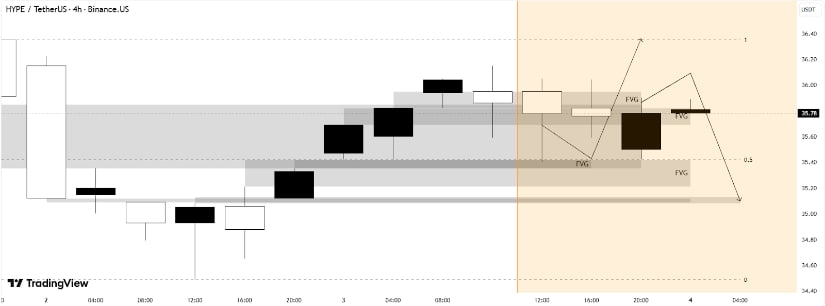
On the 4-hour chart, HYPE is exhibiting a controlled bullish expansion marked by higher highs and higher lows, a sign of improving short-term momentum. Price is now approaching a premium zone filled with Fair Value Gaps (FVGs), which often act as magnets for price due to previously unfilled inefficiencies.
HYPEUSDT on the 4-hour timeframe is exhibiting controlled bullish expansion, with higher highs and higher lows signaling a shift into short-term upward momentum following accumulation. Source: quantativeAlpha on TradingView
From a structural perspective, this zone also aligns with buy-side liquidity above recent highs, making it a key target for continuation. Analysts following ICT (Inner Circle Trader) concepts note that the current setup reflects a typical liquidity-driven market cycle, where price moves upward to capture liquidity before potentially reversing.
Once this liquidity is tapped, attention may shift toward lower levels, including mid-range imbalances and deeper support zones where sell-side liquidity is concentrated. This reinforces the importance of waiting for confirmation signals, such as changes in market structure, before positioning for reversals.
Bitcoin Influence and Altcoin Strength: Hyperliquid in a Macro Context
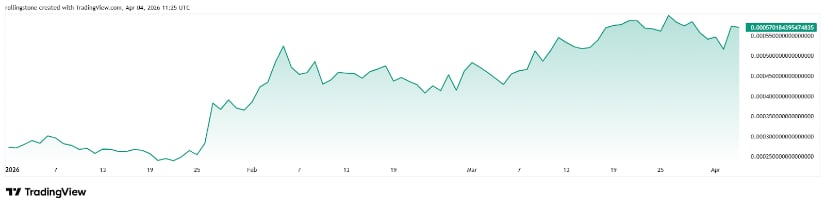
Bitcoin’s overall market direction closely influences Hyperliquid’s performance, a common dynamic across the altcoin sector. During periods of macro-driven volatility, assets that demonstrate relative strength often attract increased attention.
HYPE/BTC price chart. Source: TradingView
In this context, HYPE’s ability to hold key support levels while maintaining a structured accumulation pattern suggests underlying demand. Its positioning as a derivatives-focused Layer-1 platform also aligns with growing interest in decentralized trading infrastructure, particularly as market participants seek alternatives to centralized exchanges.
However, macro conditions, including liquidity trends, risk appetite, and Bitcoin’s price trajectory, continue to play a decisive role. Any sustained move higher in HYPE will likely require confirmation from broader market strength rather than isolated technical signals.
Outlook: Balanced Market Awaits Breakout Confirmation
In summary, Hyperliquid (HYPE) is currently in a state of equilibrium, with technical indicators and price structure reflecting a balance between buyers and sellers. Key support around $35 remains intact, while resistance between $36.50 and $38.50 continues to cap upside attempts.
A decisive breakout above this range could validate bullish momentum and open the path toward higher liquidity zones near $40. Conversely, failure to hold current levels may expose the asset to renewed downside pressure toward established support zones.
For now, the market appears to be consolidating, with traders closely monitoring for confirmation of the next directional move.
Source link