NASDAQ Short Term Forecast Update And Follow Up


Traders Workshop – For Real Success – You Need To Learn From The Best! Complete Trading School by Vladimir Ribakov

Hi Traders! NASDAQ short term forecast update and follow up is here. On March 31st, 2026 I shared this “Forex Market Analysis & Day Trading Opportunity | NASDAQ | 31 March 2026” post in our blog. In this post, let’s do a recap of this setup and see how it has developed now. If you would like to learn more about the way we trade and the technical analysis we use then check out the Home Trader Club. Spoiler alert – free memberships are available!
 Join the Home Trader Club
Want to access the tools, systems, and real-time education we use daily?
With AvaTrade Broker’s support, you can now enjoy up to one full year of access to the Home Trader Club — including:
-
All professional trading systems
-
Access to our new project, the Home Trader Club trade copier, where our traders trade and you can copy.
-
Real-time trade ideas and setups
-
Full access to our course library and trading marketplace
 Join here: https://tracking.avapartner.com/dR0AAA
My Idea
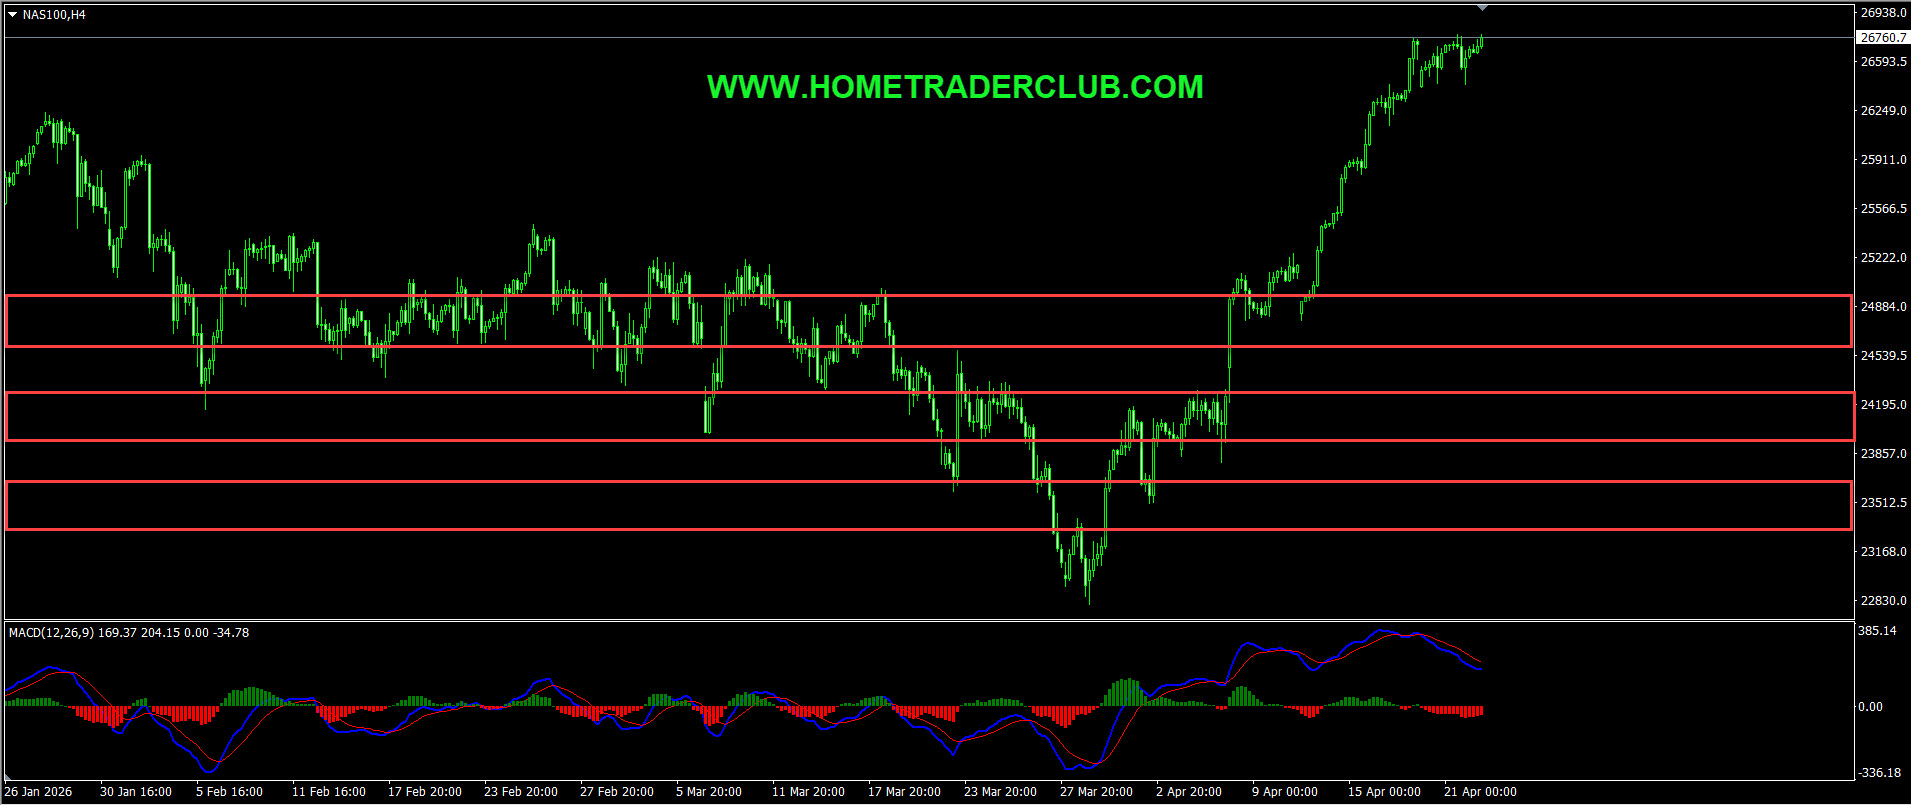
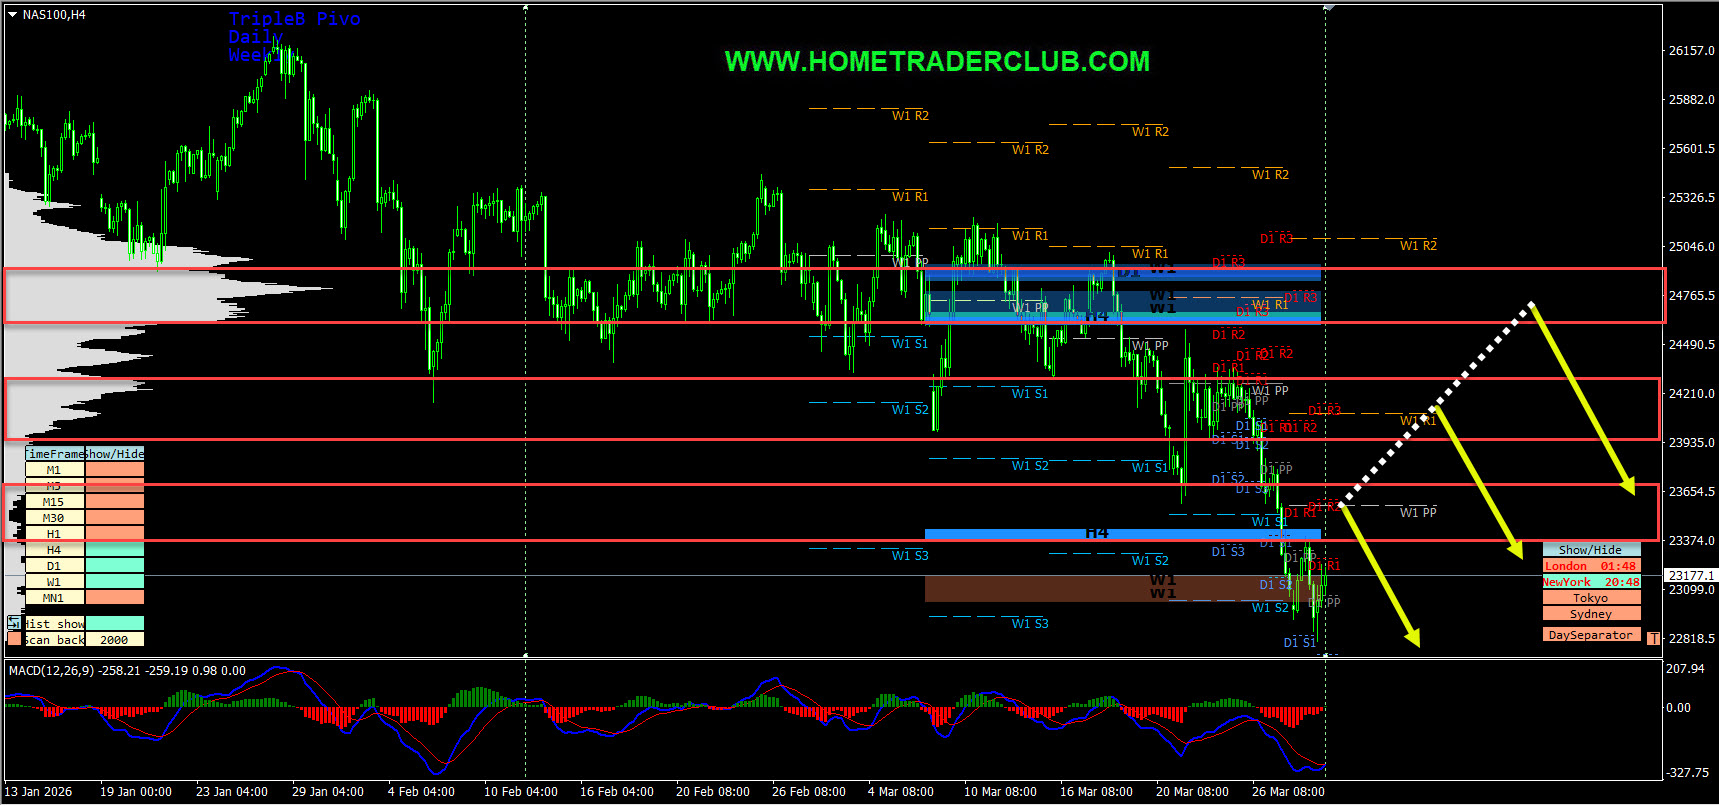
On the H4 chart, we have a strong bearish momentum and also currently there are no signs opposing this short term bearish view. So everything looks good for the bears here as well. In addition to this, we have three key resistance zones that has formed based on the volume profile zones of the KTLI indicator and the Triple B Pro pivot levels. Until these three key resistance zones shown in the image below (marked in red) holds my short term view remains bearish here and I expect the price to move lower further.
NASDAQ H4(4 Hours) Chart Current Scenario
In NASDAQ based on the above-mentioned analysis my short-term view was bearish and until the three key resistance zones hold I was expecting the price to move lower further after pullbacks. The price action didn’t follow my analysis here and this idea failed. After the strong bearish move the price which was moving higher reached the third key resistance zone. The price then moved higher further and we got a valid breakout above this key resistance zone thus invalidating this short-term bearish view.
So, traders, this is why I wanted to show this example to help you understand why we should always trade based on the facts and hints provided by the market and take the right actions according to that. Even though we had various facts supporting the bearish view here, the price didn’t hold in the three key resistance zones as I expected it to and broke above them, which is a contradictory sign provided by the market opposing the bearish view. Also, you should keep in mind that losses are part of trading we can’t expect every trade to go as per our plan and provide us profits. In trading, we can’t avoid losses but in order to be successful in trading, we should know how to cut losses early and how to manage the trade when the price goes in the opposite direction.
Note: You can watch the webinar on how to cut losses early here
Not sure how to enter a trade? Spot reversals (bounces)? Not sure how to spot breakouts?
I invite you to
And improve your trading with us.
Also, you can get one of our strategies free of charge. You will find all the details here
Download our best forex indicators here
If you have any further questions, don’t hesitate to drop a comment below!
Happy Trading!
Arvinth Akash
Home Trader Club Team.
Source link