Using Relative Strength To Find Market Leading Stocks
One of the most useful ways to evaluate a stock is to compare its performance to the overall market.
This concept is known as relative strength.
Instead of asking whether a stock is going up or down, relative strength asks a different question: Is the stock performing better or worse than the market?
As they say, “the tide lifts all boats”.
When the overall market is strong, most stocks tend to rise along with it.
When the overall market is weak, most stocks tend to drop with it.
So how is an investor going to know if a stock is a leader or a laggard?
When the market is moving higher, large amounts of money are flowing into equities.
This inflow often pushes many stocks upward at the same time, even those of companies that are not particularly strong.
As a result, simply seeing a stock go up does not necessarily mean it is a strong performer.
It may just be benefiting from the general market trend.
A stock can rise in price and still be considered weak if the overall market is rising faster.
Likewise, a stock might fall slightly but still show strength if the market is declining even more.
Plotting the relative strength graph helps investors quickly know if the stock is leading or lagging the market.
This will make sense when we look at some in StockCharts.
Contents
Next to the symbol search field in StockCharts, we have two charting formats.
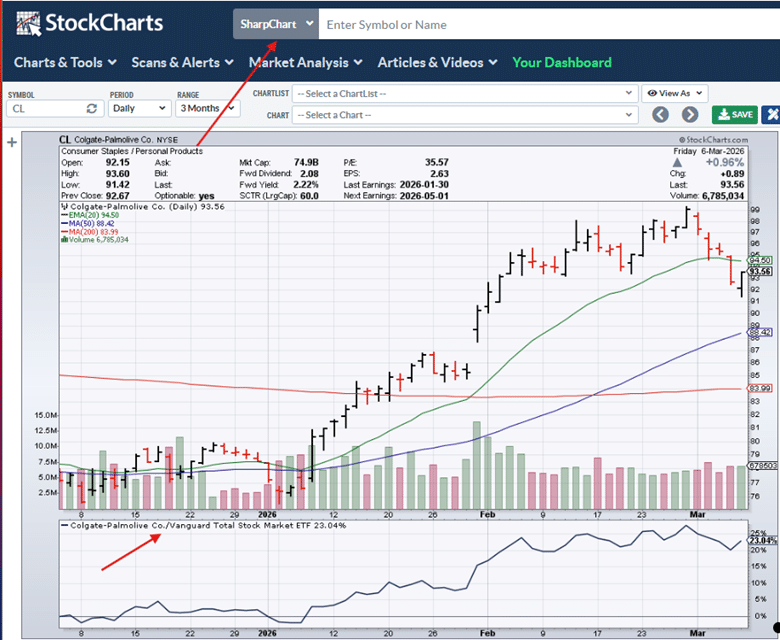
Let’s look at SharpChart first.
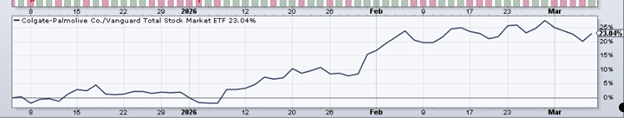
I’ve entered the symbol CL for Colgate-Palmolive and have configured a relative strength panel beneath the chart.
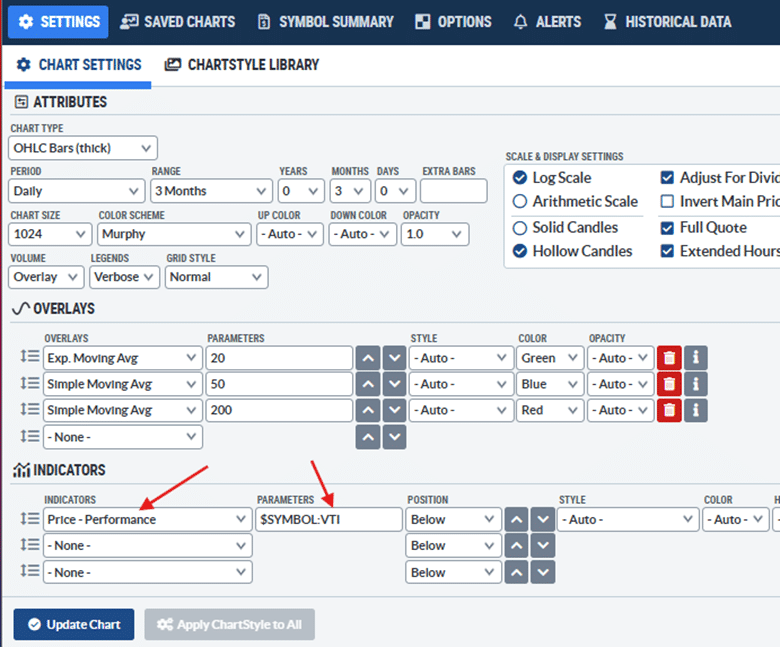
I’m calling it the “relative strength panel”, but StockCharts calls it the “Price Performance” indicator, which you can find in the indicators settings:
This indicator has an additional parameter that you can set.
By default, it is set to “$SYMBOL: VTI.”
VTI is the symbol for the “Vanguard Total Stock Market ETF.”
The relative strength panel compares the price performance of CL relative to VTI.
StockCharts displays a Relative Strength line that compares a stock’s price to a benchmark such as VTI.
It is calculated by dividing the stock price by the benchmark ETF’s price and expressed as a percentage.
If you want it compared to the S&P 500 instead, you can change “VTI” to “SPY” in the parameters field.
SPY is the symbol for the S&P 500 ETF.
Changing to SPX doesn’t work; I’ve tried it.
In any case, the graph will be quite similar whether you use VTI or SPY as your comparison base.
In the panel, we can clearly see that CL is outperforming the market – at least in the past three months.
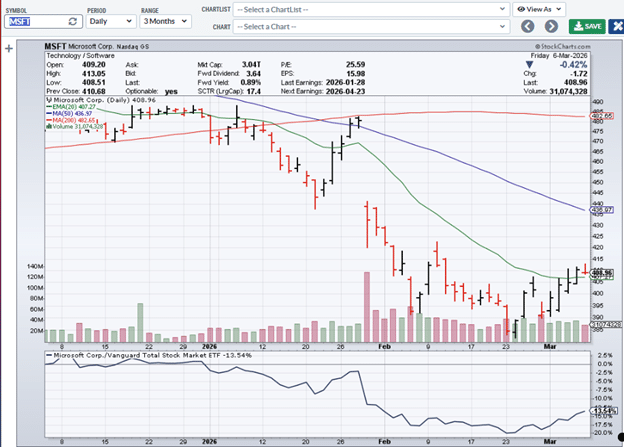
In contrast, Microsoft (MSFT) has been underperforming the market in the last three months…
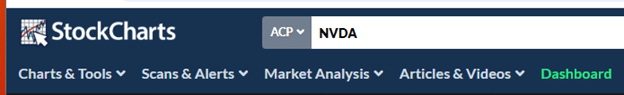
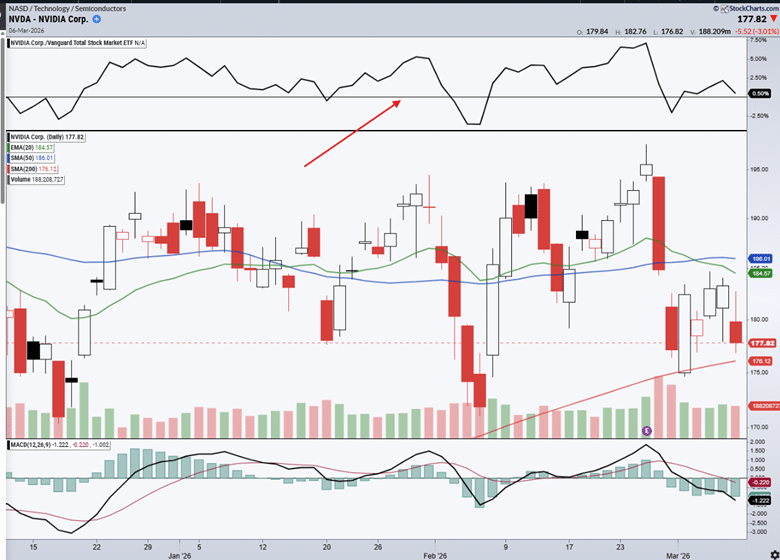
To use StockChart’s newer charting format, switch the search to “ACP” and enter a ticker symbol…
Here we are looking at Nvidia (NVDA) set to a three-month timeframe…
See how, in this case, NVDA flips below and above the 0% horizontal line.
It is neither outperforming nor underperforming the market.
It is matching the market.
Relative strength helps investors determine whether a stock is truly outperforming the broader market or simply moving along with it.
The relative strength line shown on charting platforms makes this comparison easy to visualize.
A rising line indicates the stock is outperforming the market, while a falling line signals underperformance.
Many professional investors and traders will look at a stock’s relative strength before buying.
Now you know how to access that tool.
We hope you enjoyed this article on using relative strength to find leading stocks.
If you have any questions, please send an email or leave a comment below.
Trade safe!
Disclaimer: The information above is for educational purposes only and should not be treated as investment advice. The strategy presented would not be suitable for investors who are not familiar with exchange traded options. Any readers interested in this strategy should do their own research and seek advice from a licensed financial adviser.
Source link