Schedule for Week of March 2, 2025
by Calculated Risk on 3/01/2025 08:11:00 AM
The key report scheduled for this week is the February employment report.
Fed Chair Powell speaks on the economic outlook on Friday.
10:00 AM: ISM Manufacturing Index for February. The consensus is for the ISM to be at 50.8, down from 50.9 in January.
10:00 AM: Construction Spending for January. The consensus is for a 0.2% increase in construction spending.
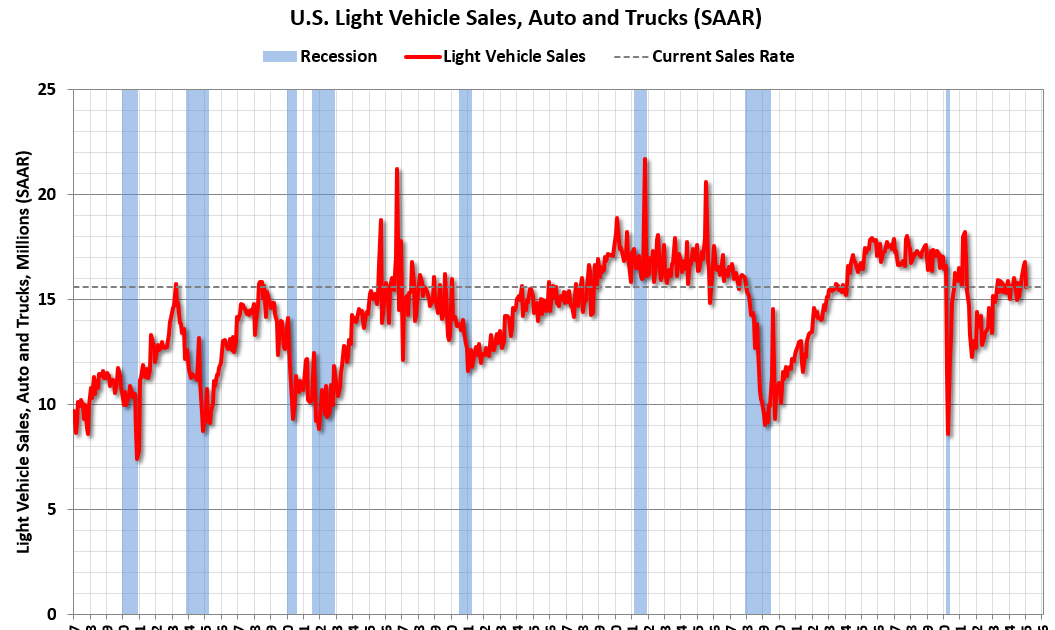
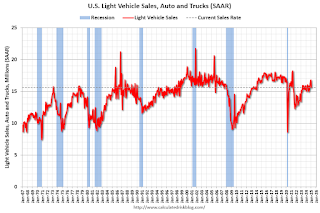
 All day: Light vehicle sales for February. Sales were at 15.6 million in January (Seasonally Adjusted Annual Rate). The consensus is for an increase in sales to 15.9 million SAAR.
This graph shows light vehicle sales since the BEA started keeping data in 1967. The dashed line is the January sales rate.
No major economic releases scheduled.
7:00 AM ET: The Mortgage Bankers Association (MBA) will release the results for the mortgage purchase applications index.
8:15 AM: The ADP Employment Report for February. This report is for private payrolls only (no government). The consensus is for 140,000 payroll jobs added in February, down from 183,000 added in January.
10:00 AM: the ISM Services Index for February.
2:00 PM: the Federal Reserve Beige Book, an informal review by the Federal Reserve Banks of current economic conditions in their Districts.
8:30 AM: The initial weekly unemployment claims report will be released. There were 242 thousand initial claims last week.
 8:30 AM: U.S. International Trade in Goods and Services for January from the Census Bureau.
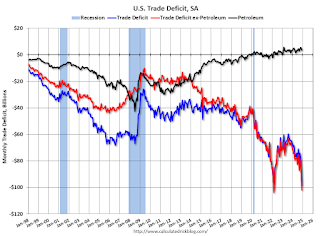
This graph shows the U.S. trade deficit, with and without petroleum, through the most recent report. The blue line is the total deficit, and the black line is the petroleum deficit, and the red line is the trade deficit ex-petroleum products.
The U.S. trade deficit was at $98.4 billion in December.
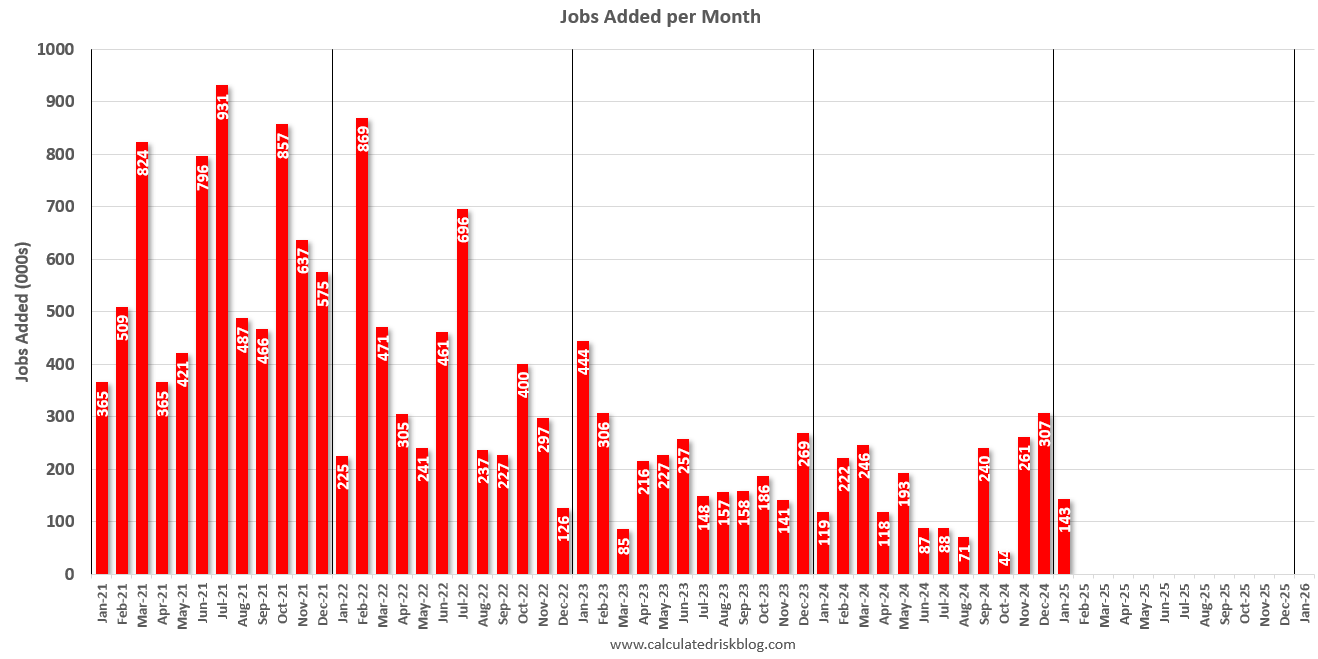 8:30 AM: Employment Report for February. The consensus is for 158,000 jobs added, and for the unemployment rate to be unchanged at 4.0%.
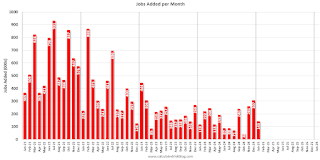
There were 143,000 jobs added in January, and the unemployment rate was at 4.0%.
This graph shows the jobs added per month since January 2021.
12:30 PM: Speech, Fed Chair Jerome Powell, Economic Outlook, At The University of Chicago Booth School of Business 2025 U.S. Monetary Policy Forum, New York, N.Y.
Source link