Speculator Extremes: AUD, Steel & Soybean Oil lead weekly Bullish Positions
By InvestMacro
The latest update for the weekly Commitment of Traders (COT) report was released by the Commodity Futures Trading Commission (CFTC) on Friday for data ending on Tuesday March 24th.
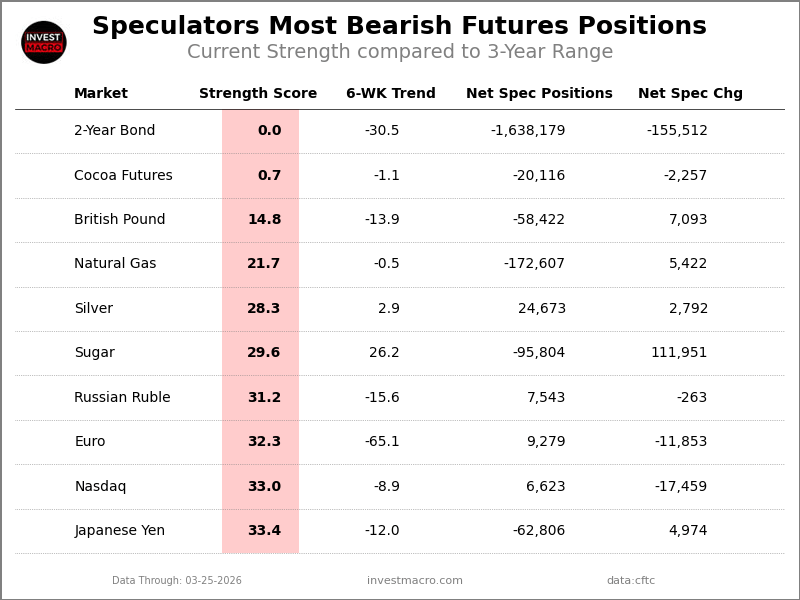
This weekly Extreme Positions report highlights the Most Bullish and Most Bearish Positions for the speculator category and is a current snapshot of how speculators were positioned as of Tuesday. Extreme positioning in these markets can foreshadow strong moves in the underlying market.
To signify an extreme position, we use the Strength Index (also known as the COT Index) of each instrument, a common method of measuring COT data. The Strength Index is simply a comparison of current trader positions against the range of positions over the previous 3 years. We use over 80 percent as extremely bullish and under 20 percent as extremely bearish (Compare Strength Index scores across all markets in the data table or cot leaders table).
The 6-WK Trend score is the change in the Strength Index over the past 6 weeks and signals how strong and which way the Strength Index is going.
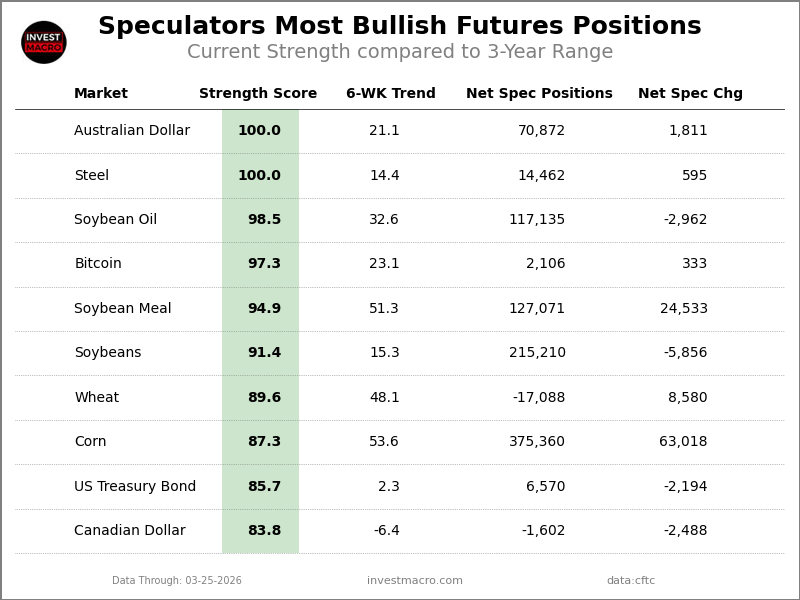
Here Are This Week’s Most Bullish Speculator Positions:
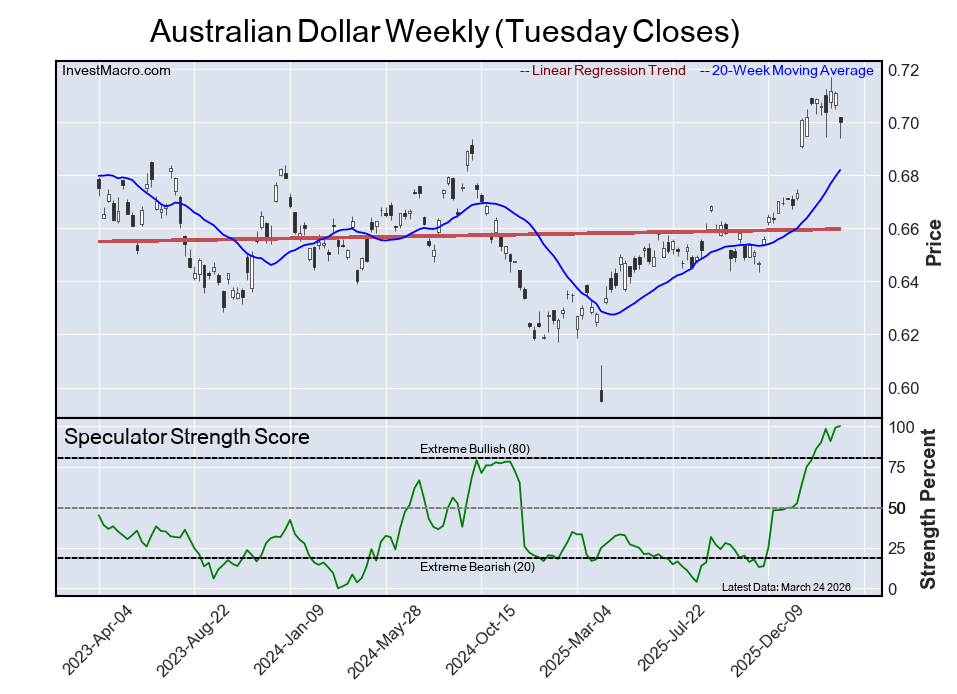
Australian Dollar
The Australian Dollar speculator position once again comes in at the top of the extreme standing this week with a maximum 100% score out of its three-year range. The six-week trend for the strength score was a gain of 21% this week while the speculator net position registered a total of 70,872 net contracts this week after a weekly change of 1,811 contracts.
Speculators or Non-Commercials Notes:
Speculators, classified as non-commercial traders by the CFTC, are made up of large commodity funds, hedge funds and other significant for-profit participants. The Specs are generally regarded as trend-followers in their behavior towards price action – net speculator bets and prices tend to go in the same directions. These traders often look to buy when prices are rising and sell when prices are falling. To illustrate this point, many times speculator contracts can be found at their most extremes (bullish or bearish) when prices are also close to their highest or lowest levels.
These extreme levels can be dangerous for the large speculators as the trade is most crowded, there is less trading ammunition still sitting on the sidelines to push the trend further and prices have moved a significant distance. When the trend becomes exhausted, some speculators take profits while others look to also exit positions when prices fail to continue in the same direction. This process usually plays out over many months to years and can ultimately create a reverse effect where prices start to fall and speculators start a process of selling when prices are falling.
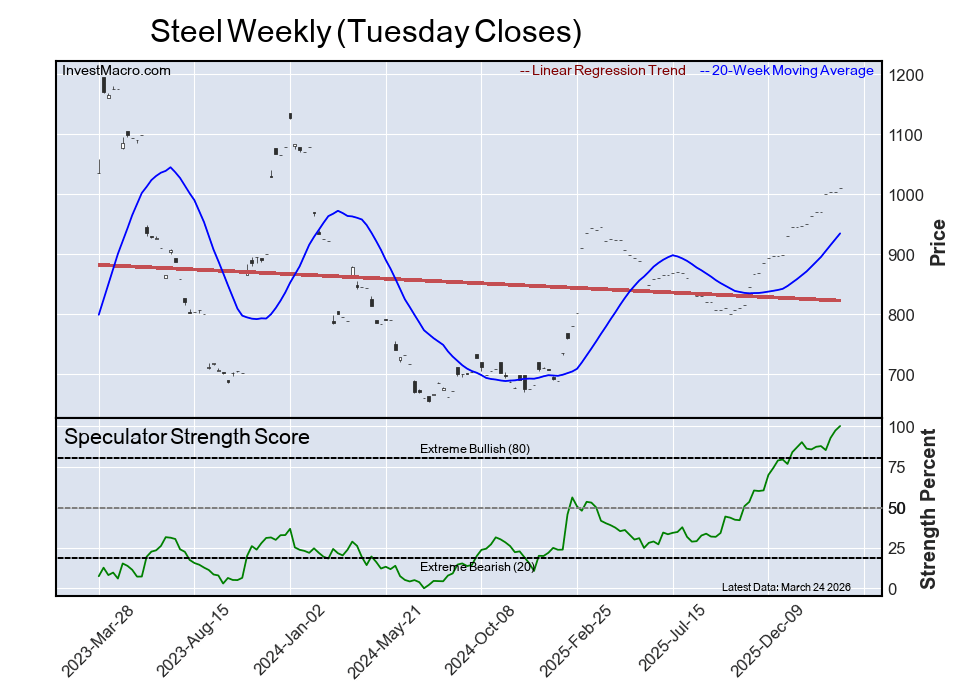
Steel
The Steel speculator position comes in tied as the most bullish extreme standing this week as the Steel speculator level is currently at a 100 percent score of its 3-year range.
The six-week trend for the percent strength score totaled a change of 14 percentage points this week. The overall net speculator position was a total of 14,462 net contracts this week with a gain of 595 contract in the weekly speculator bets.
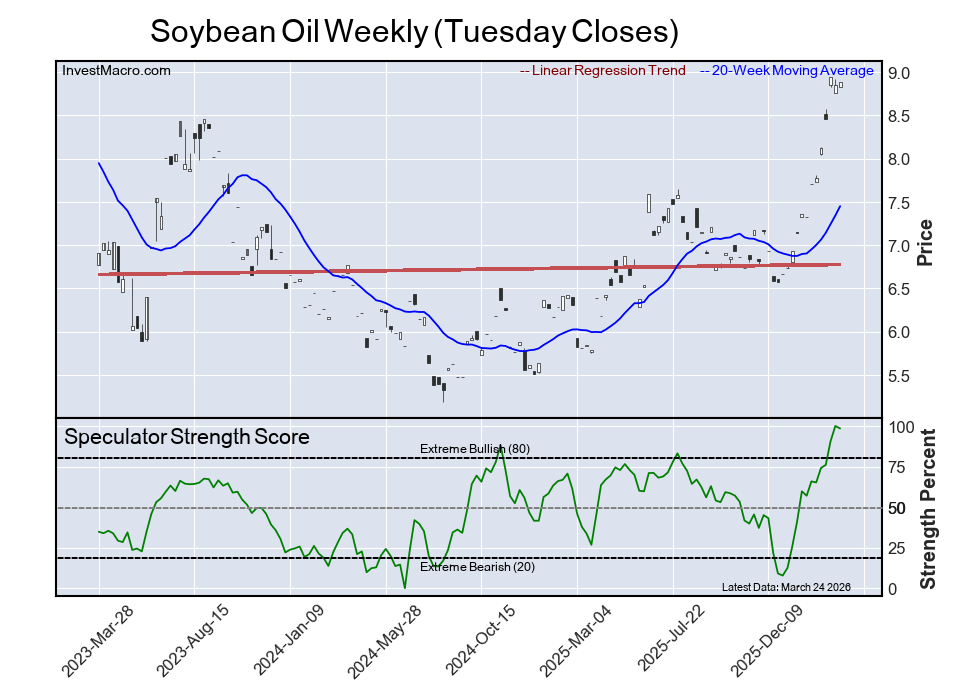
Soybean Oil
The Soybean Oil speculator position comes in third this week in the extreme standings as the Soybean Oil speculator level resides at a 98 percent score of its 3-year range.
The six-week trend for the speculator strength score came in at a gain of 33 percentage points this week. The overall speculator position was 117,135 net contracts this week with a dip by -2,962 contracts in the weekly speculator bets.
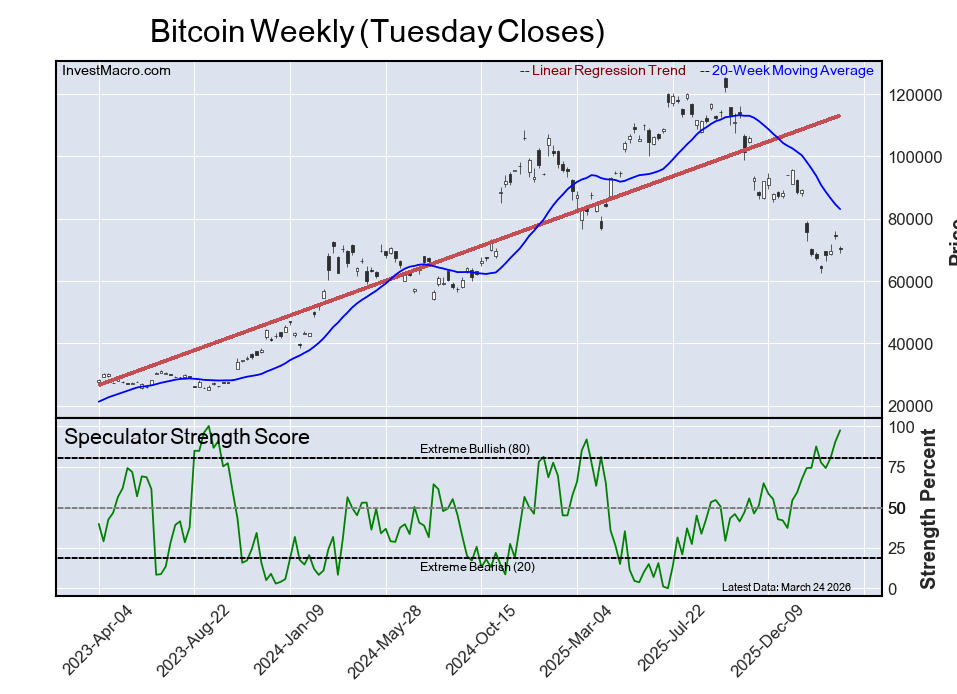
Bitcoin
The Bitcoin speculator position comes up number four in the extreme standings this week. The Bitcoin speculator level is at a 97 percent score of its 3-year range.
The six-week trend for the speculator strength score totaled a rise of 23 percentage points this week while the overall speculator position was 2,106 net contracts this week with an increase of 333 contracts in the speculator bets.
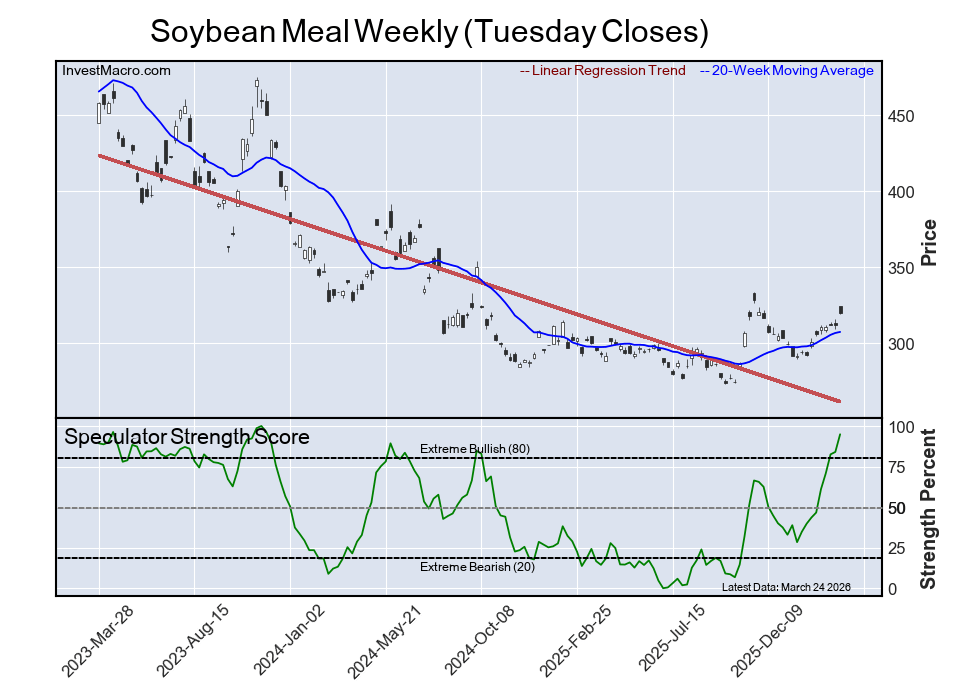
Soybean Meal
The Soybean Meal speculator position rounds out the top five in this week’s bullish extreme standings as this market sits at a 95 percent score of its 3-year range. The six-week trend for the speculator strength score was a jump by 51 percentage points this week.
The speculator position was 127,071 net contracts this week with a rise of 24,533 contracts in the weekly speculator bets.
The Most Bearish Speculator Positions of the Week:
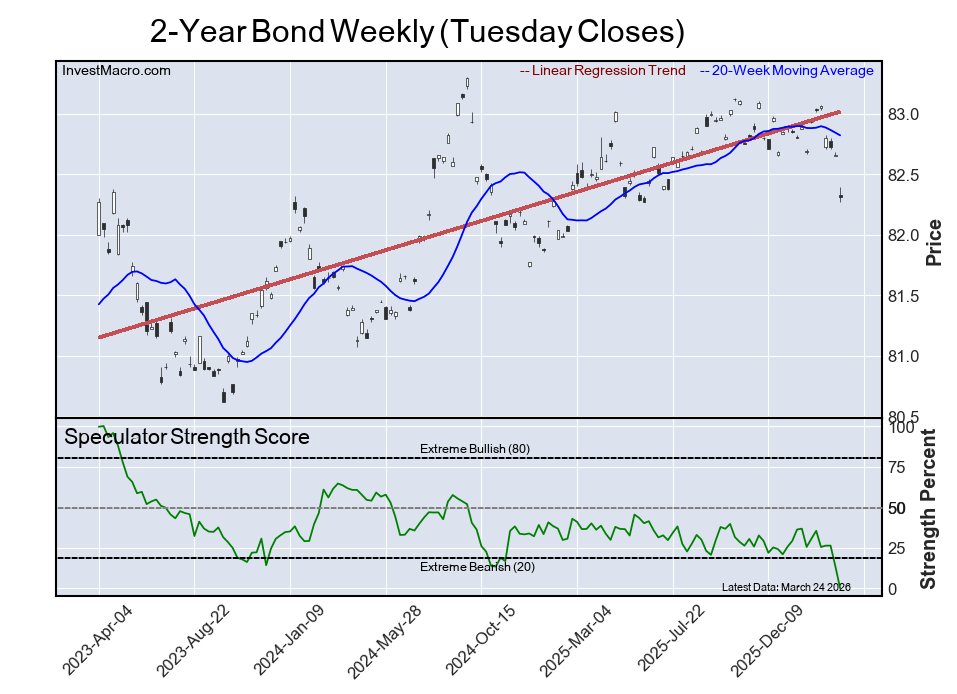
2-Year Bond
The 2-Year Bond speculator position comes in as the most bearish extreme standing this week as the 2-Year speculator level is at a 0 percent score of its 3-year range.
The six-week trend for the speculator strength score was a drop by -31 percentage points this week while the overall speculator position was -1,638,179 net contracts this week with a decline of -155,512 contracts in the speculator bets.
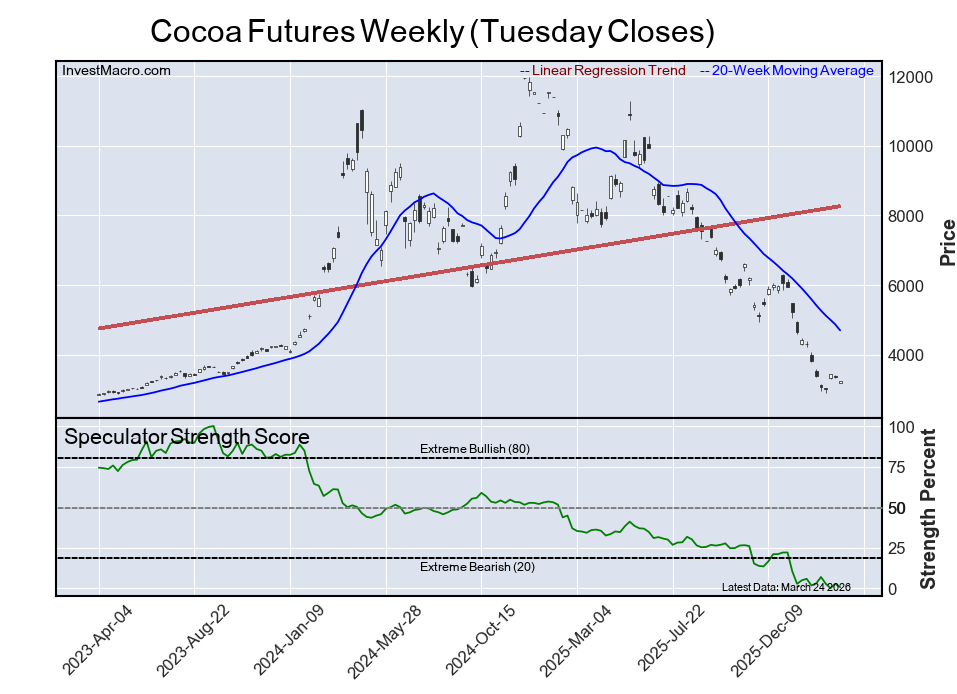
Cocoa Futures
The Cocoa Futures speculator position comes in next for the most bearish extreme standing on the week with the Cocoa speculator level at just a 1 percent score of its 3-year range.
The six-week trend for the speculator strength score was a dip of -1 percentage points this week. The speculator position was -20,116 net contracts this week with a decline of -2,257 contracts in the weekly speculator bets.
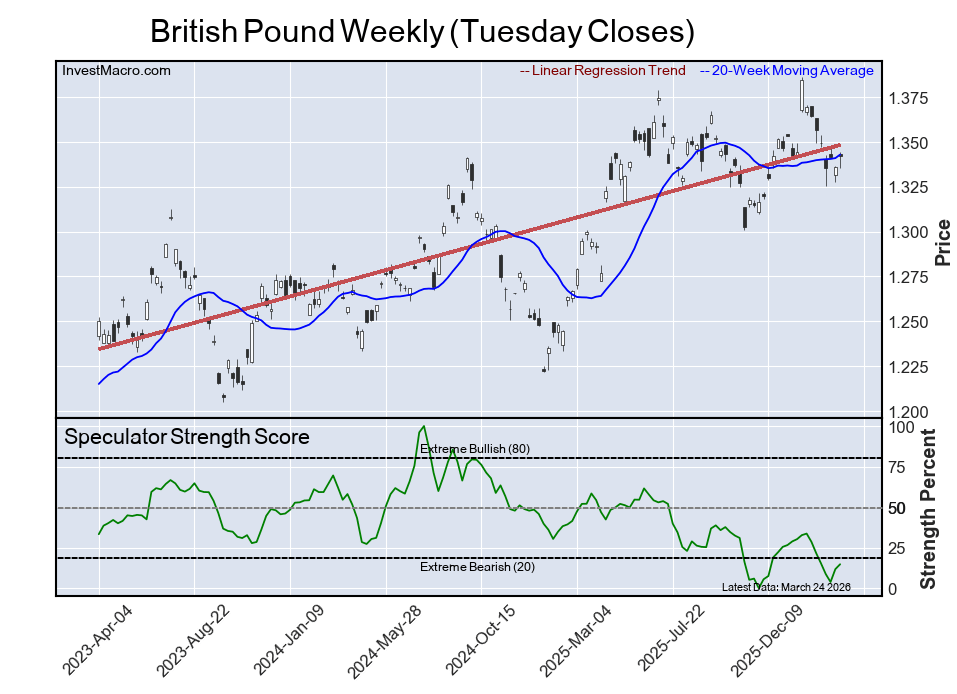
British Pound
The British Pound speculator position comes in as third most bearish extreme standing of the week. The GBP speculator level resides at a 15 percent score of its 3-year range.
The six-week trend for the speculator strength score was a decrease by -14 percentage points this week. The overall speculator position was -58,422 net contracts this week with a gain of 7,093 contracts in the speculator bets.
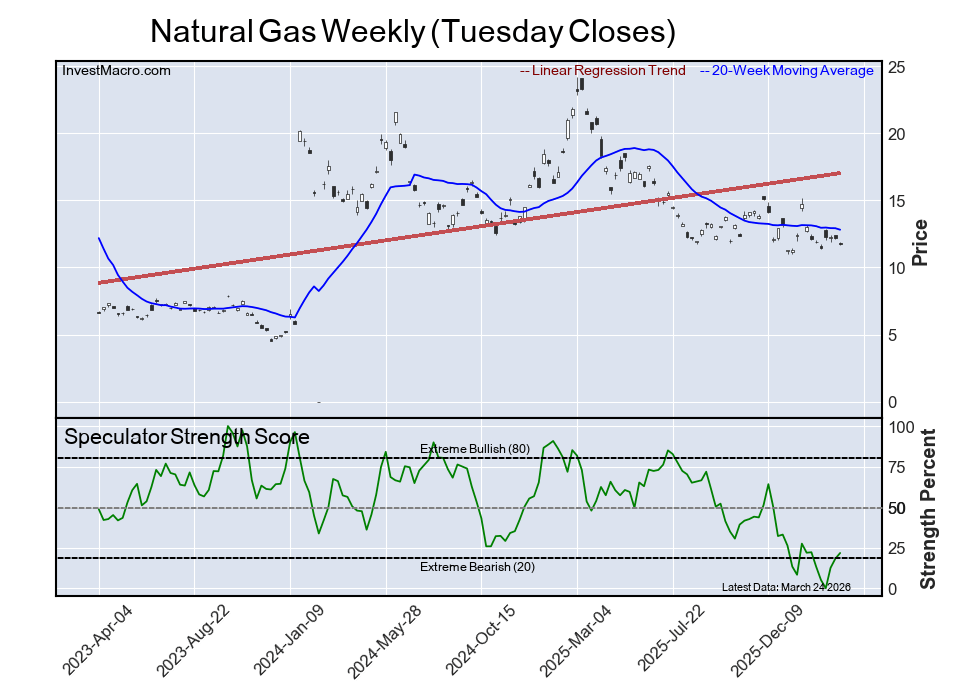
Natural Gas
The Natural Gas speculator position comes in as this week’s fourth most bearish extreme standing as the Natural Gas speculator level is at a 22 percent score of its 3-year range.
The six-week trend for the speculator strength score was unchanged this week while the speculator position was -172,607 net contracts this week with a gain of 5,422 contracts in the weekly speculator bets.
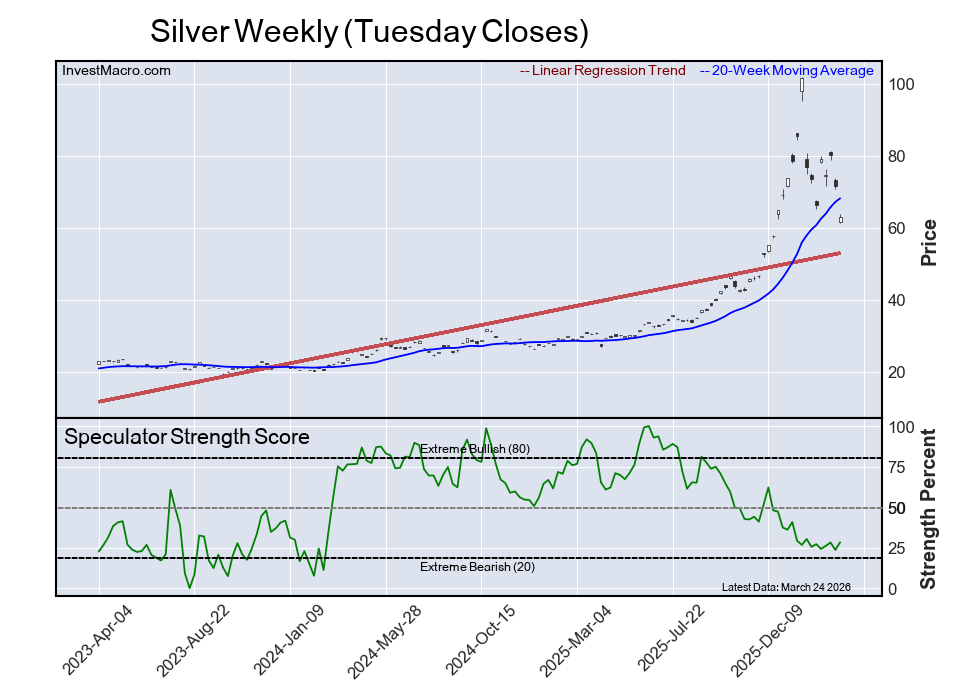
Silver
Next, the Silver speculator position comes in as the fifth most bearish extreme standing for this week as the Silver speculator level is at a 28 percent score of its 3-year range.
The six-week trend for the speculator strength score was a small gain of 3 percentage points this week and the speculator position was 24,673 net contracts this week with a small boost of 2,792 contracts in the weekly speculator bets.
Article By InvestMacro – Receive our weekly COT Newsletter
*COT Report: The COT data, released weekly to the public each Friday, is updated through the most recent Tuesday (data is 3 days old) and shows a quick view of how large speculators or non-commercials (for-profit traders) were positioned in the futures markets.
The CFTC categorizes trader positions according to commercial hedgers (traders who use futures contracts for hedging as part of the business), non-commercials (large traders who speculate to realize trading profits) and nonreportable traders (usually small traders/speculators) as well as their open interest (contracts open in the market at time of reporting). See CFTC criteria here.

- COT Metals Charts: Steel Speculator Bets continue to rise to New Record High Mar 29, 2026
- COT Bonds Charts: Weekly Speculator Bets boosted by record week for 5-Year Bonds Mar 29, 2026
- COT Energy Charts: Speculator Bets led by WTI, Natural Gas & Brent Crude Oil Mar 29, 2026
- COT Soft Commodities Charts: Sugar and Corn continue to see strong Speculator Bets Mar 29, 2026
- Week Ahead: Iran risk – hold longer with Gold Futures/Index Mar 27, 2026
- The Bank of Mexico unexpectedly cut the interest rate. The US natural gas prices rose to 3 dollars per MMBtu Mar 27, 2026
- Oil remains volatile. Iran rejected the US plan to resolve the conflict and put forward its own conditions Mar 26, 2026
- GBP/USD Eyes Middle East: Details Matter to the Market Mar 26, 2026
- CPI pressure is slowing in Australia. The RBNZ intends to ignore temporary inflation spikes Mar 25, 2026
- USD/JPY Maintains Growth Mood: Market Sympathies on the US Dollar Side Mar 25, 2026
Source link