VantagePoint AI Stock of the Week – AEHR Test Systems ($AEHR) – VantagePoint $AEHR


The AI stock spotlight this week is AEHR Stest Systems ($AEHR)
If the stock market were a high school cafeteria, Aehr Test Systems would be that quiet kid in the corner who suddenly shows up senior year driving a sports car and everyone asks, “Wait… what does he do?”
Founded in the 1970s building test gear for semiconductors, Aehr spent decades as a niche player nobody bragged about, then stumbled into the electric vehicle and silicon carbide boom at exactly the right time, scaled from obscurity into a key supplier for chip burn-in testing, and now sits in the middle of one of the most important supply chains on earth, because if chips don’t work, nothing else does, and markets have a funny habit of caring deeply about things that suddenly matter.
Now let’s talk about what this company actually does, because this is where things go from boring to profitable.
Aehr Test Systems makes equipment that tests semiconductor chips under stress before they go out into the world. Think of it like putting a car engine on a torture rack before selling it to customers. If the chip survives heat, voltage, and time, it goes into your EV, your data center, or your AI model. If it doesn’t, well, better to find out in the lab than when your Tesla is doing 70 on the highway.
Their bread and butter is something called wafer-level burn-in and test systems. That sounds like a phrase invented to make interns cry, but it simply means testing chips earlier and faster, before they’re cut and packaged. Faster testing equals lower costs and higher yields. And in semiconductors, yield is religion.
The big money driver right now is silicon carbide. These are the chips used in electric vehicles and high-power applications. They run hotter, faster, and more efficiently than traditional silicon. Which also means they are more temperamental than a hedge fund manager on margin. They need testing. A lot of testing. Enter $AEHR.
Their main customers are semiconductor manufacturers and suppliers tied to EVs and power electronics. Names like ON Semiconductor and other silicon carbide producers have historically been key relationships. When those customers ramp production, Aehr sells more systems. When those customers pause, Aehr suddenly looks like it caught a cold.
The company is based in Fremont, California. Small team. Roughly a couple hundred employees. Leadership is led by CEO Gayn Erickson, who has been around long enough to know that timing matters more than brilliance in this business. Aehr’s competitive set includes larger semiconductor equipment players like Teradyne and Advantest, but Aehr carved out a niche. It is not trying to be everything. It is trying to be essential in one very specific, very hot corner of the market.
And that niche is why traders care.
Now let’s look at the financials, because this is where people either make money or excuses.
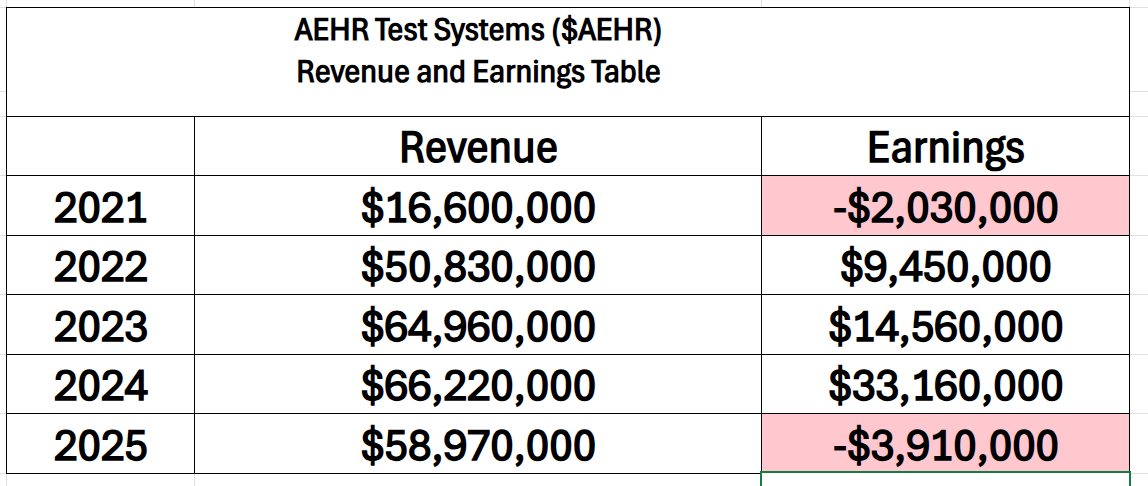
At $AEHR, the numbers tell a story that feels less like a straight line and more like a series of sharp turns, underscoring just how volatile the ride has been inside the finance department. Revenue has surged an impressive 255% over the past five years, a signal that demand for its test and burn-in solutions has meaningfully expanded, particularly alongside the electrification and semiconductor cycles. But earnings have refused to follow a neat trajectory, swinging from losses to profitability and back again, culminating in 2025, which marked the company’s weakest year on the bottom line despite still-elevated sales. Management has pointed to a combination of customer concentration, timing of large system orders, and ongoing investments in capacity and next-generation platforms as the primary drivers of that earnings compression, framing it less as structural deterioration and more as a transitional phase. The company has emphasized efforts to diversify its customer base, smooth revenue visibility, and improve gross margins through scale and product mix, while signaling that profitability should normalize as orders convert and utilization improves. Looking ahead to 2026, the expectation from management and the Street is for a return to positive earnings, with a rebound driven by resumed order flow and operating leverage finally beginning to assert itself.
Margins have actually been solid for a company this size. When demand is there, they make good money on their systems. When demand pauses, margins compress. This is not a subscription business. It’s more like selling shovels during a gold rush. When the miners take a break, you’re not selling many shovels.
Cash position has generally been healthy. Debt is low, which traders like because it means fewer existential risks. Capital intensity is moderate. They are not building fabs, but they are building specialized equipment, which still costs real money.
Here’s what traders often misunderstand. They think $AEHR is a smooth growth story tied to EV adoption. It’s not. It’s a capital equipment cycle story. That means revenue comes in waves, not in straight lines. If you don’t understand that, you will buy the top and complain about “the fundamentals” later.
Now let’s get to the questions traders are actually asking right now.
First question. Is silicon carbide demand real or just another hype cycle dressed up in a lab coat? If EV adoption continues and power efficiency matters, silicon carbide is real. If EV demand slows, $AEHR feels it immediately.
Second question. Are customers ordering more systems right now or sitting on their hands? This matters because $AEHR revenue depends heavily on large orders. One big deal can change a quarter. One delay can wreck it.
Third question. Is this a one-customer story? Concentration risk is real. If a key customer slows down, Aehr doesn’t just feel it, it feels like the floor moved.
Now let’s talk about what’s been happening lately, because stocks don’t move on history, they move on expectations.
Over the last 30 days, the stock has been moving higher. The narrative driving that move is simple. Renewed optimism around semiconductor demand, especially tied to AI and power infrastructure, combined with the idea that silicon carbide demand is stabilizing or re-accelerating.
What’s actually new is not some revolutionary product announcement. It’s sentiment shifting. Traders are starting to believe the worst of the slowdown may be behind the company.
What’s already priced in is a decent amount of recovery. The market has moved from “this story is broken” to “this story might be back.” That transition alone can drive a stock higher.
What Wall Street may be missing is how quickly this can flip again. This is not a slow-moving utility stock. It’s a sentiment-driven equipment name. If orders don’t show up, optimism disappears faster than free drinks at a hedge fund party.
Expectations could be wrong in both directions. Bulls may be assuming a clean recovery in demand. Bears may be underestimating how tight supply chains can get when demand returns.
Now, why has the stock been strong not just recently but over the past 90 days and year to date? Because the narrative has shifted from collapse to stabilization to potential growth. Over the past 90 days, the move has been driven by traders rotating back into semiconductor names, especially those tied to AI infrastructure and power efficiency. $AEHR gets pulled along because it sits in that ecosystem.
Year-to-date, the stock has benefited from a broader semiconductor rally. When the sector moves, smaller names with leverage to specific themes tend to move more.
If you compare it to a broad semiconductor ETF like VanEck Semiconductor ETF, Aehr tends to be more volatile. It outperforms on the way up and underperforms on the way down. That’s the deal you sign when you trade smaller cap equipment names.
The narratives that helped were AI demand, EV growth, and power efficiency. The data that actually mattered were orders, backlog, and customer commentary. Narratives get you in the door. Orders pay the bills.
Analysts generally like the long-term story. They see silicon carbide as a structural growth area. That part is grounded in reality. Where they often miss is timing. Analysts are great at telling you what should happen over five years. Traders care about what happens over the next five weeks.
Now let’s talk about what could go right and what could go wrong, because that’s the entire game.
On the upside, if silicon carbide demand accelerates faster than expected, $AEHR becomes a bottleneck provider. That’s when pricing power improves, margins expand, and the stock can run hard.
Another positive scenario is customer diversification. If $AEHR lands more large customers, the concentration risk drops and the multiple expands.
The single biggest upside surprise would be a wave of large system orders that signal a new capacity build cycle. That’s how you get those sharp, almost ridiculous rallies that make traders look like geniuses.
On the downside, if EV demand stalls or customers delay spending, Aehr’s revenue can drop quickly. This is not a defensive name. It is economically sensitive whether people want to admit it or not.
The biggest blind spot traders should respect is timing risk. You can be right about the long-term story and still lose money because you showed up six months too early.
Now, the catalyst calendar, because this is where the rubber meets the road.
Next earnings report, typically in late June or early July. This matters because it will show whether orders are actually returning or if the optimism is just talk.
Customer announcements or industry updates around silicon carbide capacity expansion. These can happen anytime but tend to cluster around major semiconductor conferences. They matter because $AEHR revenue follows customer capex.
Guidance updates. Anytime management talks about future demand, the stock reacts. This is where expectations get reset in real time.
This is not a stock for someone who wants a quiet life. This is a stock for traders who understand cycles, volatility, and the difference between a story and a paycheck.
It is best suited for momentum traders and swing traders who can ride trends and respect stops. Long-term investors can play here, but they need a strong stomach and a better sense of timing than most people possess.
For the trend to continue, one thing must stay true. Orders need to show up. Not stories, not presentations, not “strategic positioning.” Orders.
Early warning signs of trouble are simple. Weak guidance, delayed orders, or customer hesitation. If those show up, the stock won’t ask for permission to go lower.
In the end, $AEHR is a classic market lesson wrapped in a semiconductor box. It sits at the intersection of a powerful trend, but it lives and dies by timing.
And timing, as always, is where most people discover they are not as smart as they thought they were.
In this weekly stock study, we will look at an analysis of the following indicators and metrics, which serve as our guidelines in determining whether to buy, sell, or stand aside on a particular stock:
Wall Street Analysts Ratings and Forecasts
52 Week High and Low Boundaries
Best-Case/Worst-Case Analysis
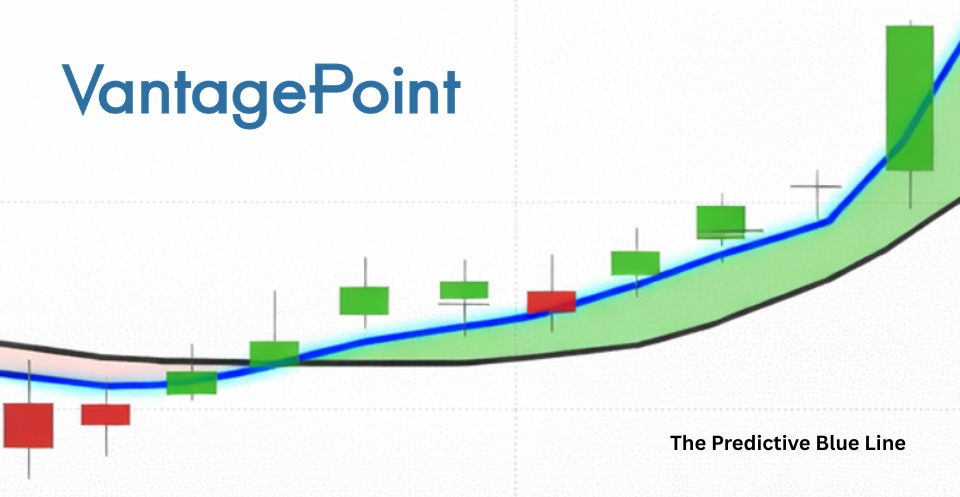
VantagePoint AI Predictive Blue Line
Neural Network Forecast (Machine Learning)
VantagePoint AI Daily Range Forecast
Intermarket Analysis
Our Suggestion
While our decisions are ultimately guided by artificial intelligence forecasts, we still take a brief look at the fundamentals to understand the financial landscape in which $AEHR is operating.
Wall Street Analysts Price Forecasts
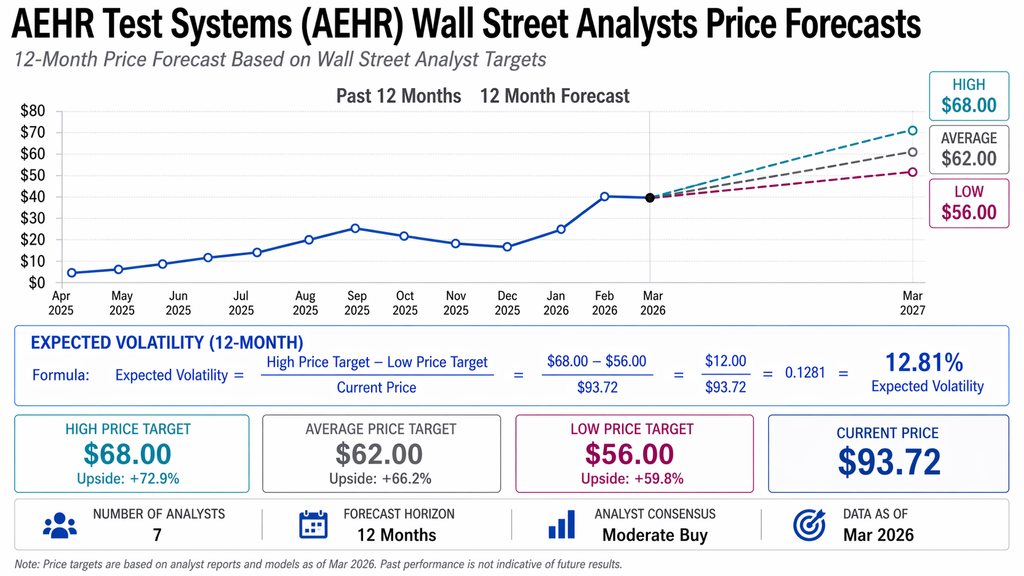
Analysts like to think they’re forecasting the future. In reality, they’re often just politely describing the past with a slight delay. The spread between the high target of $68 and the low target of $56 tells you everything you need to know. That range reflects uncertainty, not precision. A tight range would signal confidence. This is not that. This is a group of professionals politely disagreeing with each other while the stock quietly ignores all of them and trades at $96. In other words, the market has already voted, and the analysts are still counting ballots.
Let’s address the uncomfortable truth. Analysts missed the move. Not by a little, but by a wide margin. When a stock is trading at $96 while the average target sits at $62, the message is simple. Reality outpaced expectations. Now comes the predictable sequel. Upgrades. Not because the story suddenly changed overnight, but because nobody on Wall Street enjoys looking like they brought a ruler to measure a rocket ship. Expect a wave of revised price targets creeping higher, dressed up in new narratives about “improving visibility” and “stronger than expected demand.”
Now here’s where this becomes useful for traders instead of entertaining for critics. The difference between the most bullish target at $68 and the most bearish at $56 gives you a forward-looking volatility framework. That $12 spread, when measured against the current price of $96, implies expected volatility of roughly 12.81%. That is the market’s polite way of saying, “We don’t agree on direction, but we do agree it’s going to move about this much.” Since the Analysts missed the move they also missed the volatility and we will quickly come to see why this is important.
52 Week High and Low Boundaries
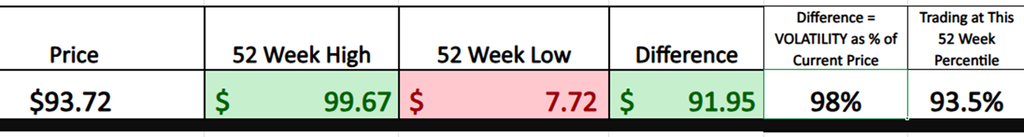
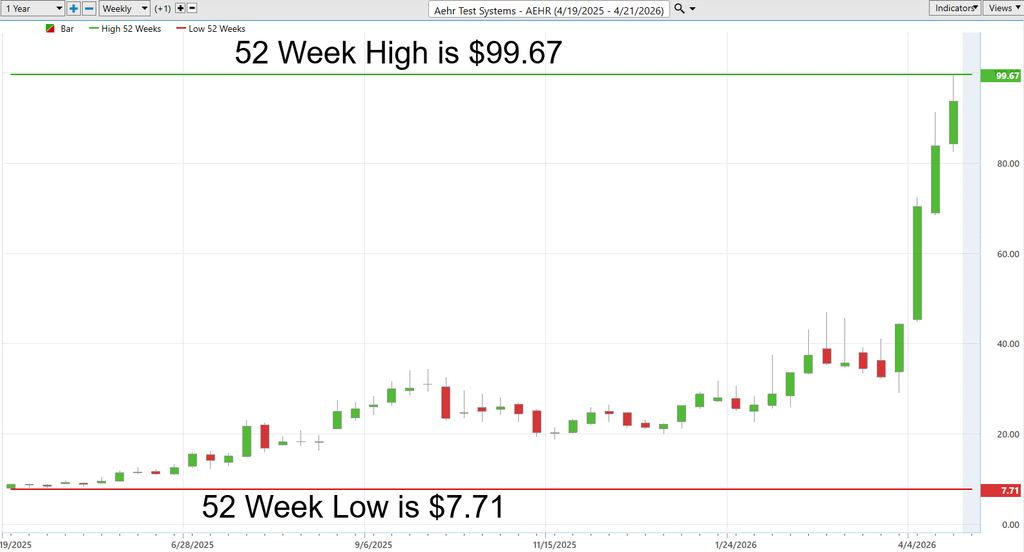
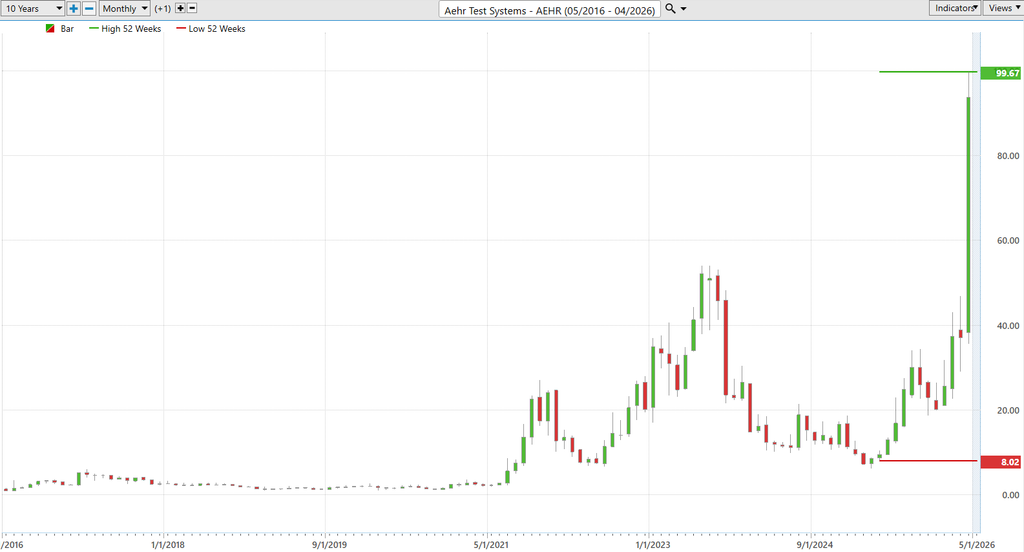
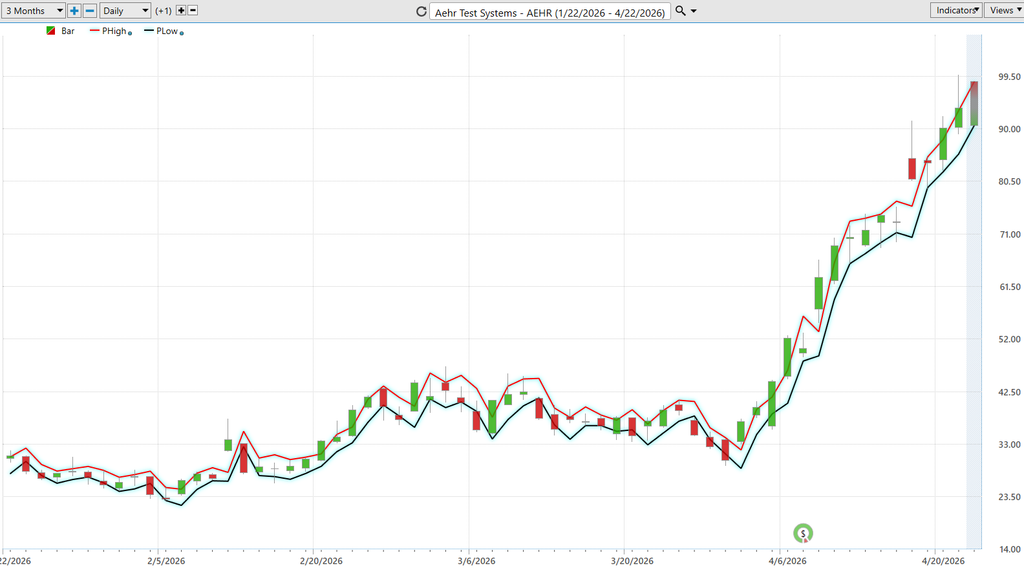
The numbers here tell a story that no analysts narrative can soften. Over the past 52 weeks, $AEHR has traded from a low of $7.71 to a high of $99.67. That is a $91.95 range. Put differently, this stock has demonstrated the ability to move nearly its entire current price, end to end, within a single year. That is not volatility in theory. That is volatility in practice. When a stock shows you this kind of range, it is effectively publishing its own résumé. It is telling you, plainly, “this is what I am capable of.” And with the current price at $93.72 sitting in the 93.5th percentile of that range, the message is even clearer. This is not a recovery story. This is a momentum story pressing against the upper boundary of its historical behavior.
Now contrast that with what Wall Street analysts just offered. A high target of $68, a low of $56, and an average of $62. While the stock trades nearly 40 percent above even the most optimistic forecast. The implication is not subtle. Analysts did not anticipate this move. They did not model it. They did not price it. Instead, they are now in the uncomfortable position of explaining why the market moved first and their spreadsheets followed later. The so-called expected volatility derived from those targets, roughly 12 to 13 percent, looks almost quaint when placed next to a realized annual range approaching 100 percent of the stock’s current price. It is the financial equivalent of bringing a raincoat to a hurricane.
And then there is the last four weeks. The move has not been gradual. It has been explosive. Price has accelerated vertically, compressing what might normally unfold over months into a matter of weeks. This is where markets tend to separate observers from participants. Momentum of this magnitude forces repositioning. It forces upgrades. And perhaps most importantly, it forces a reassessment of what is “reasonable.” Because in moments like this, the market is not asking for permission from analysts. It is simply repricing reality in real time.
There are charts that whisper. There are charts that suggest. And then there are charts like this one that kick the door in, grab you by the collar, and say, “Pay attention.” $AEHR has just done something that doesn’t happen often and never quietly. It is printing a new 10-year high at the exact same time it is making a new 52-week high. That’s not coincidence. That’s confirmation. It means every bag holder from the last decade has either been paid, forgiven, or run over. There is no overhead supply left to argue with the trend. The past has been cleared out like a bad tenant.
This is one of those setups traders wait for, talk about, and then somehow still hesitate on. A stock making simultaneous long-term and short-term highs is the market’s way of saying, “All known problems have been dealt with, and we’re moving on.” Whatever obstacles existed, supply chain issues, demand concerns, management questions, they’ve been absorbed, digested, and effectively dismissed by price. And price, unlike analysts or economists, does not care about being polite. It only cares about being right. When both the 10-year and 52-week ceilings are taken out together, you’re not looking at a breakout. You’re looking at an escape velocity event.
And here’s the part that makes traders either money or excuses. Moves like this are rarely neat, orderly, or considerate of your entry price. They tend to be explosive, irrational, and slightly offensive to anyone waiting for a “pullback that makes sense.” The reason is simple. There’s nothing left above to slow it down. No resistance. No memory. Just momentum and a growing crowd of people realizing, usually too late, that the train has already left the station.
Best-Case/Worst-Case Scenario Analysis
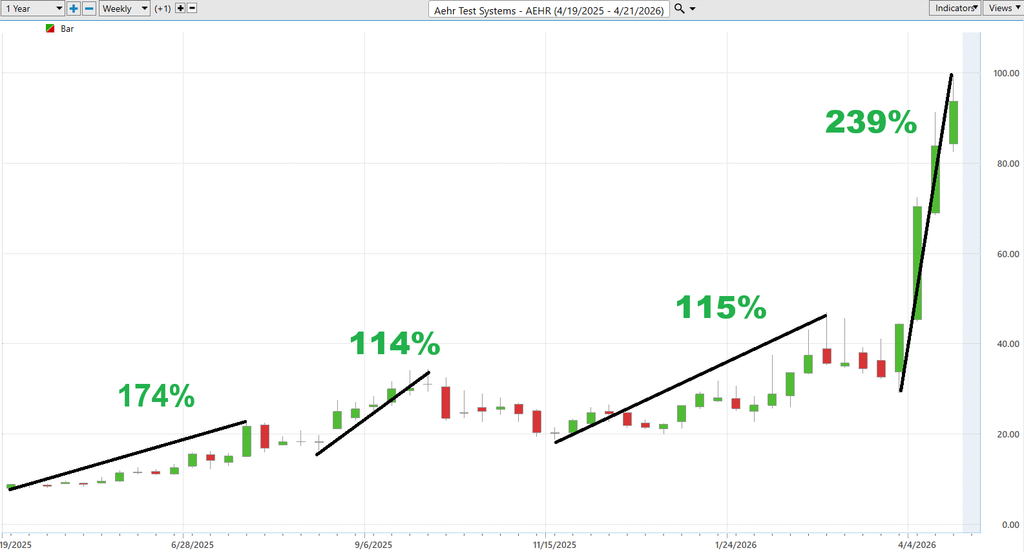
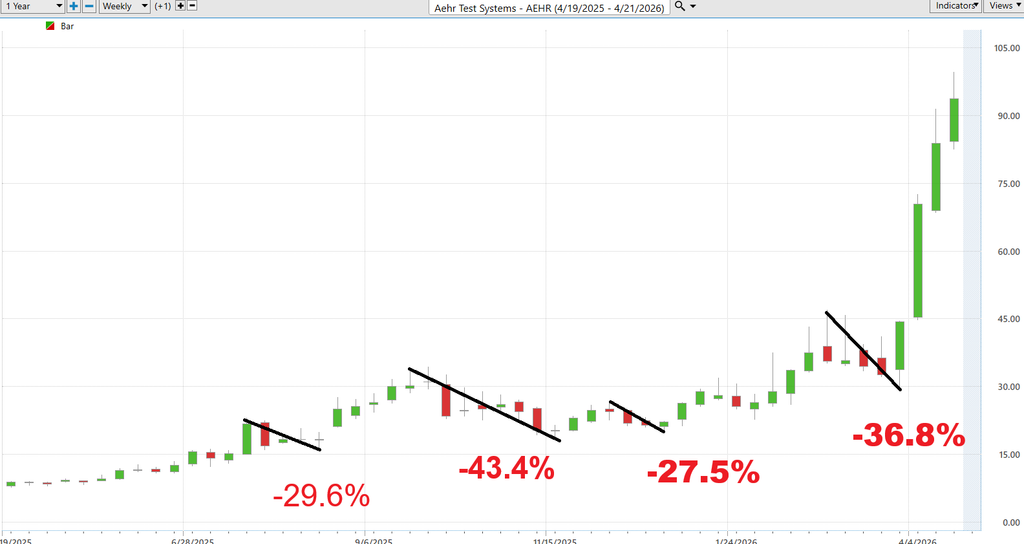
Volatility is one of those words that sounds sophisticated until the market introduces you to it personally. Then it stops being a concept and starts being an experience. These charts make that point better than any textbook ever could. On one side, you see sharp, uninterrupted declines that don’t ask for permission and don’t care about your opinion. On the other, you see explosive rallies that feel like opportunity in its purest form. This is not theory. This is behavior. And the only way to truly understand it is to study what the stock has already done over the last 52 weeks, not what someone thinks it might do next.
What stands out immediately is the asymmetry of emotion versus reality. Traders are naturally drawn to the upside moves. The 100 percent plus rallies, the vertical surges, the moments where everything looks easy and obvious in hindsight. But those same traders often treat the downside as an inconvenience rather than a certainty. The declines shown here are not small pullbacks. They are sharp, fast, and unforgiving. They happen in the same market, in the same stock, often to the same participants who were celebrating the rally just weeks earlier. The lesson is simple but rarely followed. If a stock has proven it can drop hard and fast, you have to assume it can do it again.
This is where the exercise becomes practical instead of academic. By measuring the largest uninterrupted rallies and declines, you are not predicting the future. You are defining the boundaries of what is possible. That framework becomes the foundation for position sizing. Not hope. Not conviction. Not a story. Just math rooted in reality. If the downside move is large enough to do real damage, your position has to respect that. Because in the end, the traders who survive are not the ones who dream the biggest. They are the ones who size their risk based on what the market has already proven it can do.
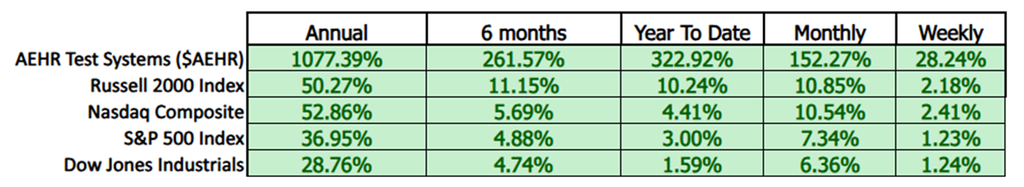
Next we compare the performance of $AEHR to the broader stock market averages.
You don’t need a magnifying glass to read this table. You need a sense of perspective. $AEHR is not just outperforming the market. It is operating in a different zip code. Across every timeframe, the stock is compounding gains at a pace that leaves the broader market looking like it’s standing still. That’s how you tell. Not by splitting hairs over percentages, but by recognizing when a stock consistently shows up at the top of every timeframe. That is what real leadership looks like. It is persistent, it is broad-based, and it does not rely on one lucky stretch.
Why this matters is simple. Markets reward strength. Capital flows toward winners, not laggards. When a stock is outperforming across multiple timeframes, it tells you institutions are involved, trends are intact, and momentum is being reinforced, not questioned. This is the foundation of relative strength. You are not guessing which stock might move. You are identifying which stock already is moving and asking whether that behavior is likely to continue. Most traders spend their time hunting for value. The professionals spend their time following strength.
As for why these numbers are so lopsided, that’s where reality steps in. The world we live in today does not run on abstract ideas. It runs on chips. Modern conflict, infrastructure, artificial intelligence, energy systems, all of it depends on semiconductors. This is not the age of bayonets and hand grenades. It is the age of silicon and power efficiency. And $AEHR sits right at the intersection of that demand. When a company finds itself at the crossroads of necessity, performance stops being average. It becomes exceptional.
VantagePoint AI Predictive Blue Line
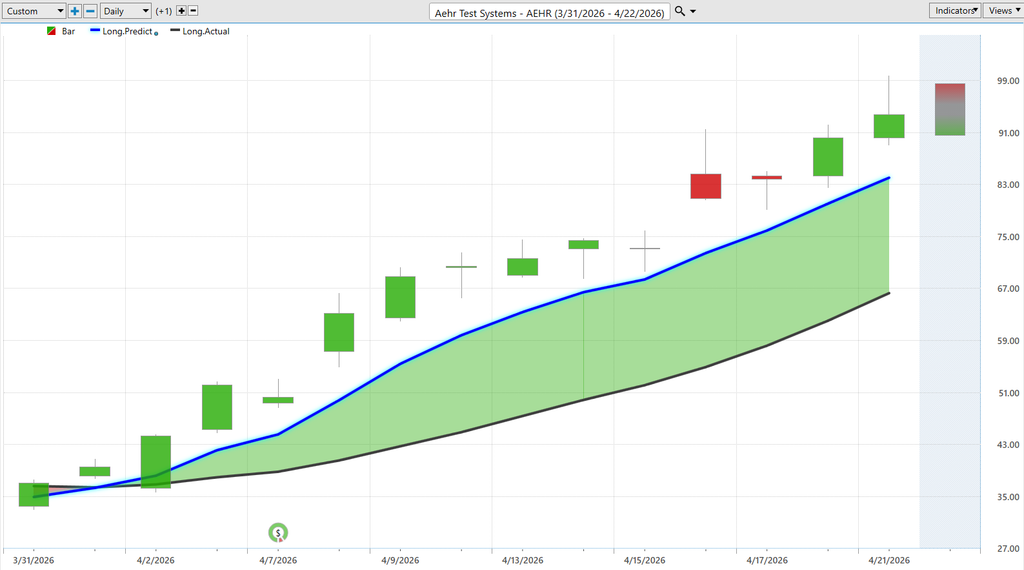
The first thing to understand about $AEHR is this: price follows the slope of the Predictive Blue Line. Not opinion. Not headlines. The slope. In the chart before you, that slope direction is rising steadily. That tells you the market is under persistent upward pressure before it becomes obvious to everyone else. The blue line is not reacting to price. It is leading it. This is not noise. This is structure. And when the slope direction of the Predictive Blue Line is rising, the path of least resistance is up. That is where money is made.
Now look at how price behaves around that line. It is not fighting it. It is respecting it. Pullbacks do not collapse. They stabilize near the blue line and then move higher. That is what professionals recognize as a value zone. When price retraces toward a rising Predictive Blue Line, it is not weakness. It is alignment. The slope direction remains upward, which means buyers are still in control. The spread between the predictive line and actual price reflects demand that continues to show up early, before the move becomes obvious to the crowd.
Finally, consider what happens when this alignment persists. A rising slope direction of the Predictive Blue Line combined with price holding above it creates sustained strength. Not temporary momentum. Sustained pressure. Short-term fluctuations will occur. The Neural Index may turn briefly. Daily ranges will expand and contract. But as long as the slope direction of the Predictive Blue Line continues higher, the message does not change. Strength builds on itself. And in a stock like $AEHR, that kind of structure has already shown it can produce fast, decisive moves once it gains traction.
VantagePoint AI Neural Index (Machine Learning)
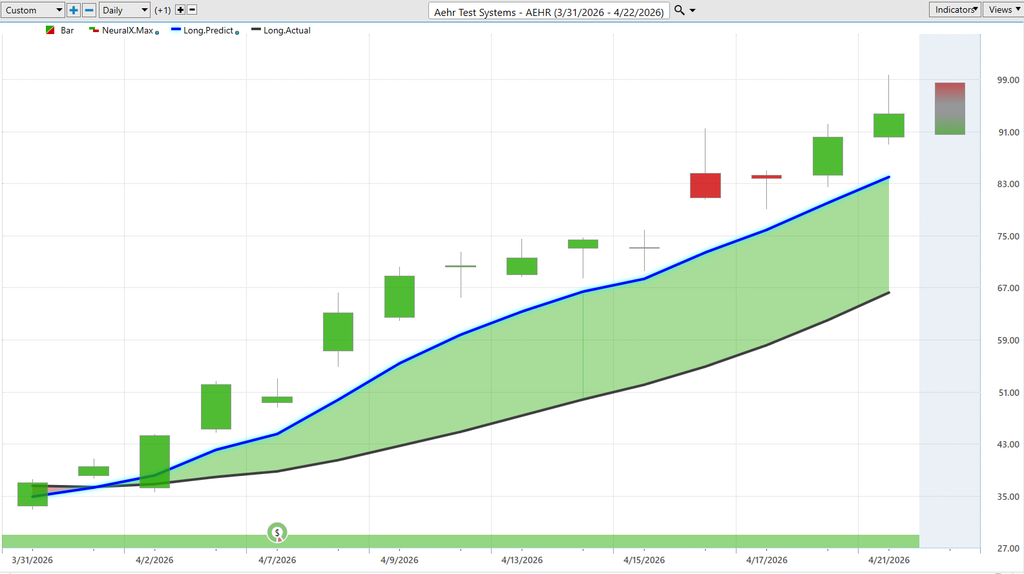
A neural network is a form of artificial intelligence built to recognize patterns that are too complex, too fast, and too interconnected for the human brain to track consistently. In trading terms, it is a machine-learning system designed to study how markets have behaved across thousands of prior conditions and then identify what those conditions are most likely to lead to next. It does not think like a human trader. It does not get excited, scared, stubborn, or hopeful. It processes relationships. Price, time, trend behavior, and intermarket influences are all fed into the model so it can detect whether the odds favor strength or weakness over the near term.
That is why it matters. Most traders make poor decisions for one simple reason. They confuse opinion with probability. A neural network helps correct that mistake by shifting the focus away from gut instinct and toward pattern recognition. In your framework, the Neural Index forecast at the base of the chart functions as a short-term forecast for the next 48 to 72 hours of price action. It is not there to predict the next six months. It is there to tell traders whether near-term conditions favor upside continuation or whether weakness is starting to creep in. When the Neural Index is green, it suggests short-term strength is likely intact. When it turns red, it is an early warning that the stock is losing momentum and price will often revert back toward the Predictive Blue Line or even below it.
That makes it extraordinarily useful for decision-making. Traders do not just need to know the big trend. They need to know whether now is a good time to press the trade or protect themselves. Using your framework, the Neural Index is up to 87.4% accurate, which is why it becomes such a practical decision tool. It helps traders avoid chasing strength at the wrong moment and helps them recognize when a strong stock may be entering a short-term cooling-off period. In a stock like $AEHR, where price can move quickly and emotions can run even faster, that kind of signal can mean the difference between entering with the trend and buying just in time for a pullback.
VantagePoint AI Daily Range Forecast
Here’s the reality most traders miss…
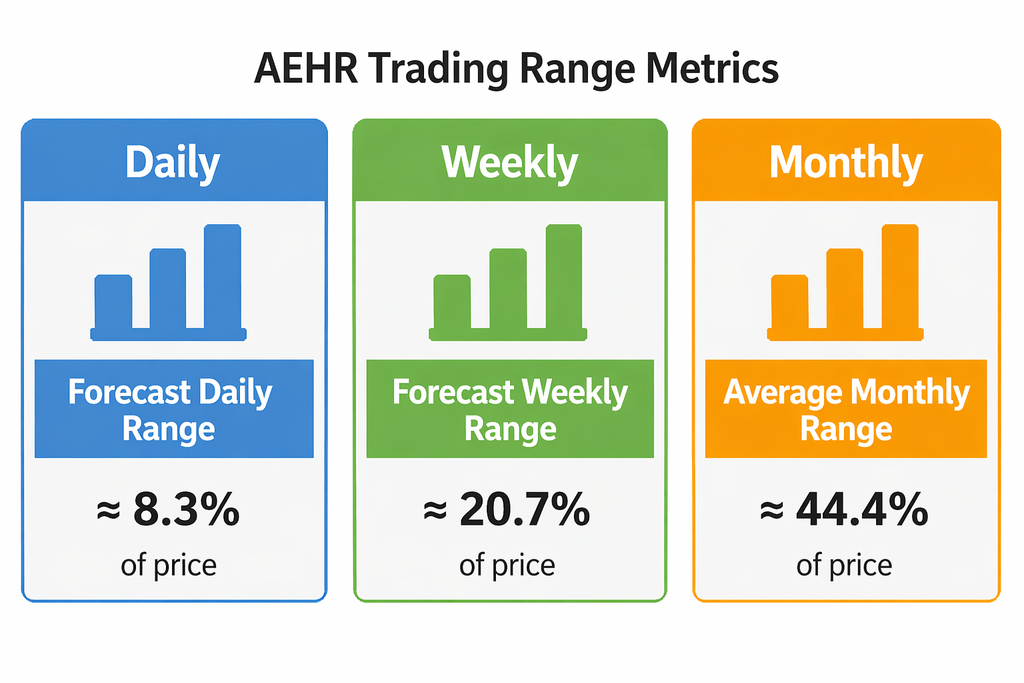
$AEHR is expanding. And when volatility expands inside an uptrend, that’s where the real money is made. Your daily range forecast is coming in around 8.3% of price, which is not normal. That’s opportunity. That means this stock is capable of making meaningful moves in a single session, not over weeks. The predicted high and low bands are widening, not contracting. That tells you one thing: this is an active battlefield, and price is moving with intent.
Now look at how price behaves relative to that range. It’s not randomly bouncing around. It’s riding the upper half of the forecast band, consistently pressing higher. That’s what strength looks like. Weak stocks live near the bottom of their range. Strong stocks live near the top. And when they keep hugging that upper boundary, it tells you buyers are stepping in early, not waiting for deep pullbacks. The market is paying up for exposure. That’s not hesitation… that’s urgency.
Traders all want to know where the risk and opportunity lives every day, and this is what the VantagePoint AI Daily Range forecast delivers. By combining AI, probabilistic models, intermarket relationships, and trend analysis, it delivers a predicted high price and predicted low price every day. Study the chart and you can see for yourself how accurate this forecast is and how valuable it proves to traders. The takeaway is simple. When you combine a rising trend with an elevated daily range, you’re looking at a stock where timing matters more than direction. Direction is already established. The edge is knowing where within that range to act. Buy weakness near the lower end of the forecast. Be cautious chasing at the extreme highs. Because in a stock like $AEHR, the move doesn’t just go up, it moves fast enough to punish bad entries. Respect the range, align with the trend, and let the volatility work for you, not against you.
VantagePoint AI Intermarket Analysis
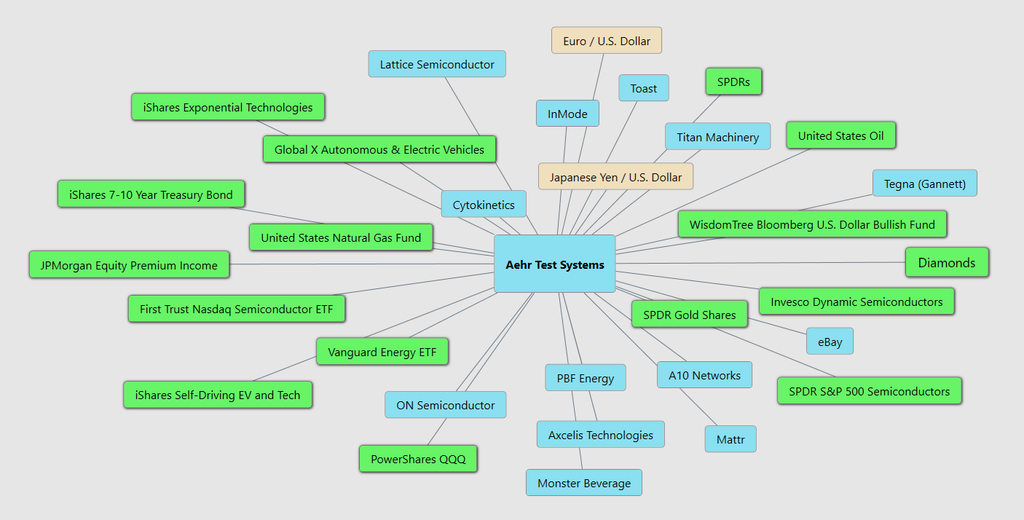
If you step back and look at this map, what you’re really seeing is a web of influence around $AEHR, not just a single stock moving on its own. Think of it like this. $AEHR sits in the middle, and everything connected to it either pushes it higher, pulls it lower, or tells you where it might go next. The biggest forces come from semiconductors, energy, and global money flows. When semiconductor ETFs and companies like ON Semiconductor and Lattice Semiconductor are strong, it signals demand for chips is rising. Since $AEHR makes equipment used to test those chips, it benefits directly. In simple terms, when more chips are needed, more testing is needed, and that is where $AEHR makes its money.
Now layer in energy and global macro. You see things like U.S. Oil, Natural Gas funds, and energy ETFs connected here. That is not random. Energy drives inflation, and inflation influences interest rates. When rates stabilize or fall, growth stocks and technology names tend to perform better. At the same time, currencies like the Yen and the Euro matter because semiconductors are a global business. If the dollar moves sharply, it can change demand, supply chains, and profitability. So while $AEHR looks like a niche semiconductor play, it is actually tied into a much bigger global machine involving commodities, currencies, and capital flows.
Finally, the ETF layer tells you where the big money is going. Funds like QQQ, semiconductor ETFs, and broad market products act like highways for institutional capital. When money flows into those, it lifts the strongest names inside them. The fact that $AEHR is surrounded by these tells you it is participating in a broader theme, not moving alone. For a trader, the takeaway is simple. You are not just trading a company. You are trading a network. When semiconductors are strong, energy is supportive, and money is flowing into tech, $AEHR tends to accelerate. When those relationships weaken, the stock can lose momentum just as quickly.
Study the graphic below and you will better understand the 31 key price drivers of $AEHR.
Our Suggestion
$AEHR is the kind of stock that can make you feel brilliant on Monday and reckless by Thursday. The story is still the same one we’ve been building: this is a semiconductor high flyer name sitting in the path of real demand from AI infrastructure, data centers, silicon photonics, and power devices. That is why the trend has been so powerful. But power cuts both ways. In a stock like this, volatility is not a side note. It is part of the deal. That means timing matters, entries matter, and risk management matters even more.
The last two earnings calls tell a pretty clear story. On the January call, management sounded more constructive because visibility improved enough for the company to reinstate guidance, and they pointed to AI processor demand, Sonoma system momentum, and a substantial customer forecast for future AI ASIC production capacity. On the April call, the tone was even more confident around demand, with management highlighting strong quarterly bookings, a book-to-bill ratio above 3.5x, a record effective backlog, a large follow-on order from its lead AI customer, and new silicon photonics wins. So yes, management sounds confident. Not chest-thumping confident, but commercially confident. They are signaling that the demand engine is real and broadening.
That does not mean the risk list disappeared. Management is still dealing with the parts of the business that can trip up a fast-moving stock: customer concentration, the timing of customer ramps, the delay between forecasts and firm purchase orders, mix pressure, and the reality that strong bookings do not always show up in reported results on the same schedule Wall Street wants. There is also the capital-markets overhang, since the company raised money through an at-the-market offering, which tells you they are strengthening the balance sheet but also reminds you this is not a low-drama story. In plain English, the opportunity is big, but execution still has to catch up quarter by quarter.
The next scheduled earnings report is currently listed for July 21, 2026, after the close, and that matters because Wall Street is now expecting the business to keep converting AI demand, silicon photonics wins, and backlog into another constructive step forward. The market is not rewarding $AEHR because of one clean quarter. It is rewarding the belief that bookings remain strong, that management can hit its stated goal of moving toward non-GAAP profitability in the fourth quarter, and that the company’s role in AI and optical interconnect testing is becoming more important, not less. That is the expectation supporting the stock now. Traders are betting the story is graduating from promise to proof.
So here is the trader’s conclusion. Use the Daily Range Forecast to exploit the short-term opportunity, because a stock this volatile rarely rewards lazy entries. Let the forecast define where the risk lives and where the opportunity lives, then size the trade accordingly. Do not treat $AEHR like a sleepy large cap. Treat it like a fast horse with a real edge and a real ability to throw you if you get careless. Great money management is not optional here. Position sizing is the difference between surviving the swings and becoming part of them.
Disclaimer: THERE IS A HIGH DEGREE OF RISK INVOLVED IN TRADING. IT IS NOT PRUDENT OR ADVISABLE TO MAKE TRADING DECISIONS THAT ARE BEYOND YOUR FINANCIAL MEANS OR INVOLVE TRADING CAPITAL THAT YOU ARE NOT WILLING AND CAPABLE OF LOSING.
VANTAGEPOINT’S MARKETING CAMPAIGNS, OF ANY KIND, DO NOT CONSTITUTE TRADING ADVICE OR AN ENDORSEMENT OR RECOMMENDATION BY VANTAGEPOINT AI OR ANY ASSOCIATED AFFILIATES OF ANY TRADING METHODS, PROGRAMS, SYSTEMS OR ROUTINES. VANTAGEPOINT’S PERSONNEL ARE NOT LICENSED BROKERS OR ADVISORS AND DO NOT OFFER TRADING ADVICE.
Source link