Scalping Tools for Forex and CFD Trading
Scalping indicators are technical tools that signal entries and exits in forex and CFD markets. They are typically applied on 1-minute to 5-minute charts during very short-term trades. These forex scalping indicators process price, momentum, and volatility data into structured readings. They suit conditions defined by tight spreads, fast execution, and small price fluctuations.
Scalpers execute many trades over minutes or seconds, aiming to capture minor price moves in active markets. Technical indicators offer the structured signals needed to support these fast decisions. This article covers the main indicators for scalping and their application to intraday trading.
Common scalping indicators include:
- Exponential Moving Average (EMA): smooths recent prices to indicate trend direction.
- Hull Moving Average (HMA): a faster moving average designed to reduce lag.
- Relative Strength Index (RSI): a momentum oscillator measuring overbought and oversold conditions.
- Bollinger Bands: volatility bands set around a moving average.
- Stochastic Oscillator: measures the closing price relative to a recent trading range to identify momentum.
- MACD: compares two moving averages to identify momentum and trend direction.
Role of Indicators in Short-Term Execution
As you may know, scalping is a trading strategy where traders aim to take advantage of small price movements by executing numerous trades within short timeframes, often closing trades within a few minutes. This approach requires swift decision-making and precise timing.
Technical indicators may be important tools in this context, as they provide real-time data and insights into market trends, momentum, and volatility. Using these indicators, traders can identify optimal entry and exit points, potentially enhancing their ability to navigate the rapid pace of the market.
Below, we’ll break down five indicators for scalping. You’ll find these scalping indicators in MT4 and MT5, and TradingView. Also, you can get started in seconds with FXOpen’s TickTrader trading platform.
Indicators in scalping are typically used for:
- Trend identification: spotting whether price is moving directionally.
- Entry timing: pinpointing moments to act on a setup.
- Volatility assessment: gauging how widely the price is swinging in real time.
Moving Averages
Moving averages (MAs) are considered by some to be the most popular indicator for scalping, smoothing out price data to help identify trends by calculating the average price over a specific period. In scalping, where quick decisions are crucial, certain types of moving averages can be useful.
Exponential Moving Average (EMA)
Unlike the Simple Moving Average (SMA), which assigns equal weight to all data points, the EMA gives more significance to recent prices, making it more responsive to current market movements. This responsiveness is advantageous for scalpers.
Common EMA settings for scalping include 5, 9, and 20 periods, depending on chart timeframe. For instance, a 9-period EMA reacts swiftly to recent price changes, potentially providing timely signals for entry and exit points. The EMA for scalping may also act as dynamic support or resistance during trending price action.
Hull Moving Average (HMA)
Developed by Alan Hull, the HMA further reduces lag. It does this by weighting recent prices more heavily and applying a different calculation. The result is a moving average that tracks price action more closely while smoothing noise.
Applying Moving Averages in Scalping
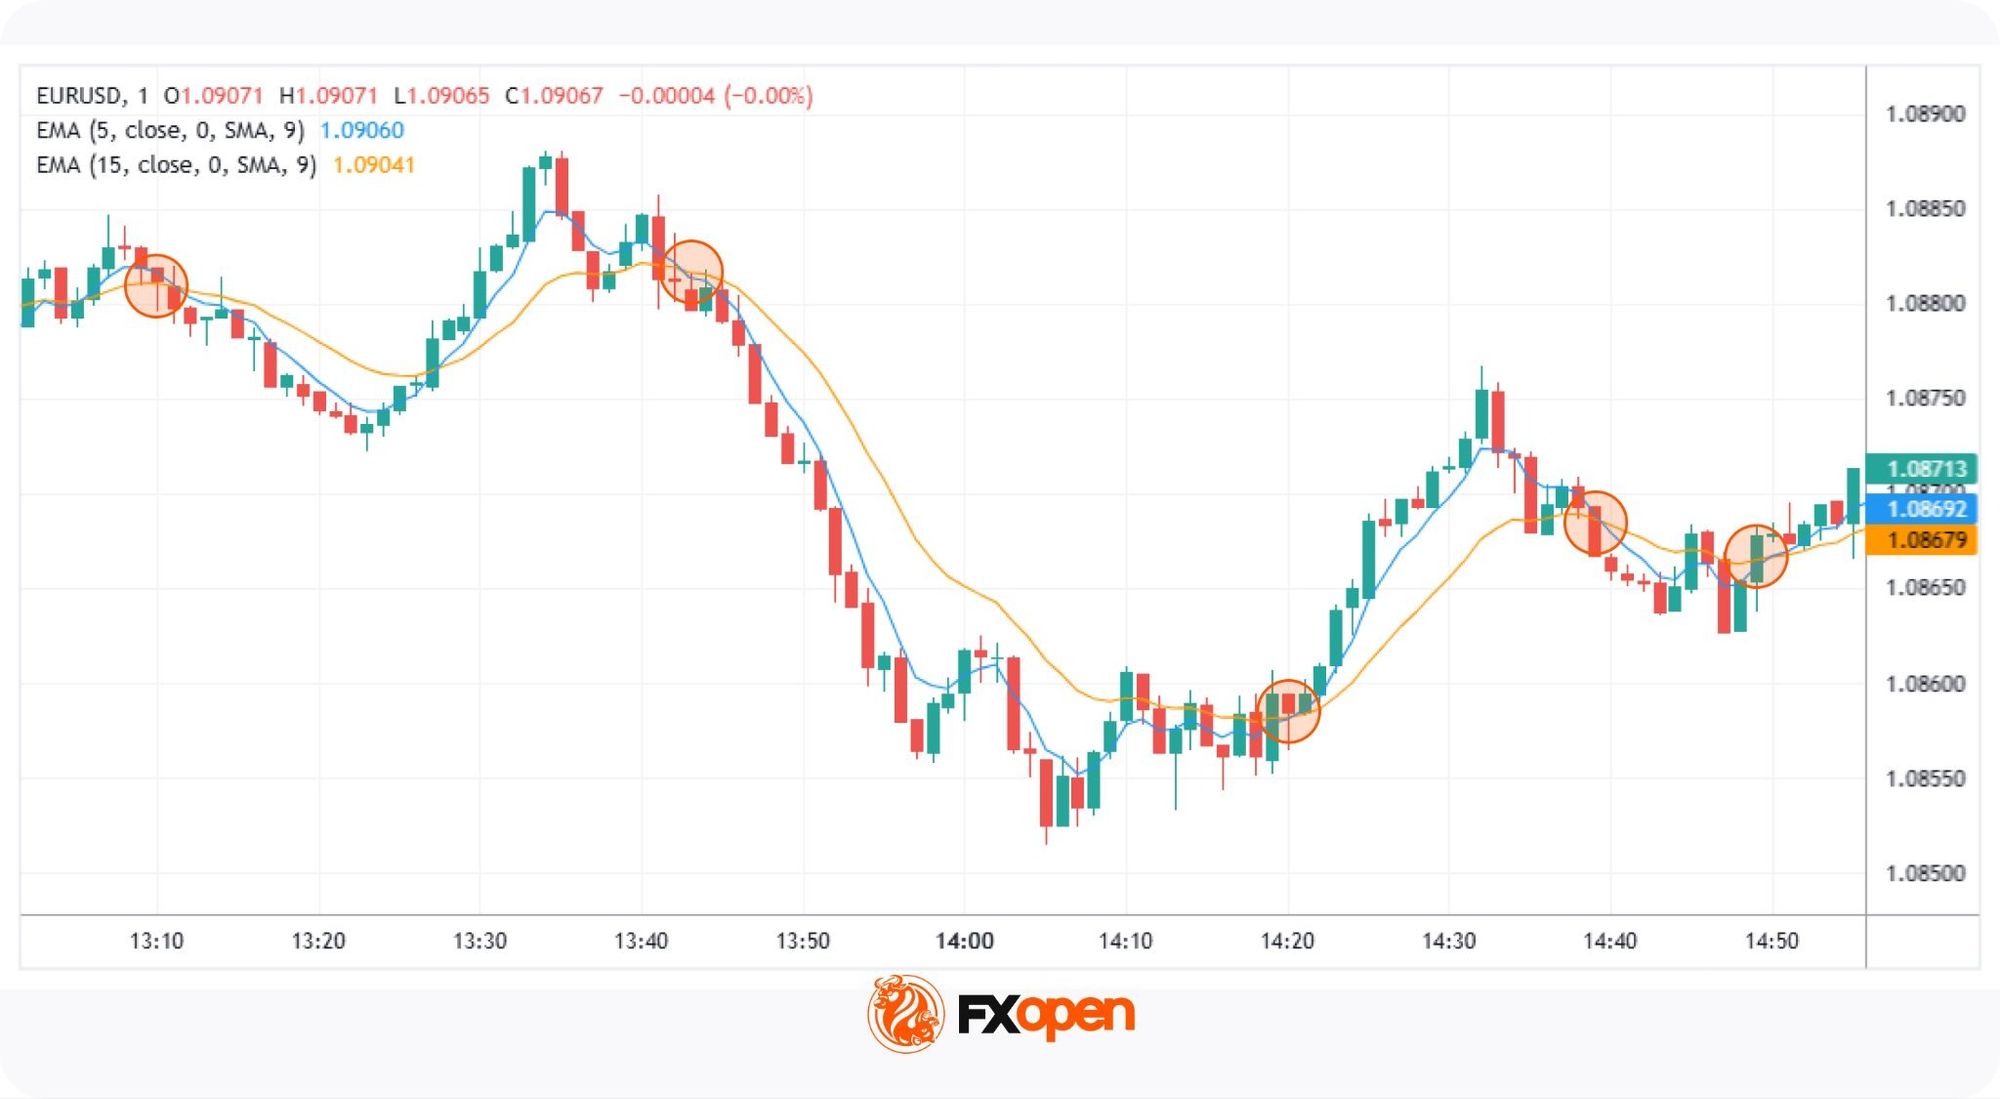
- Crossover Strategy: Scalpers often use two EMAs of different lengths. A common approach involves a fast EMA (e.g., 5-period) and a slow EMA (e.g., 15-period). When the fast EMA crosses above the slow EMA, it may indicate a bullish trend, suggesting an entry point for a buy trade or an exit point for a short trade. Conversely, when the fast EMA crosses below the slow EMA, it may signal a bearish trend, indicating a potential entry for a sell trade or moment to close a long trade.
- Trend Confirmation: The EMA and HMA can be used to confirm trends identified by other indicators. For example, if the moving average is sloping upwards, it may confirm an uptrend, supporting decisions to enter long positions. If it’s sloping downwards, it may confirm a downtrend, supporting decisions to enter short positions.
- Pullbacks: In trending markets, traders often monitor pullbacks to the EMA as potential continuation entries.
You can find these scalping indicators in TradingView and FXOpen’s TickTrader trading platform.
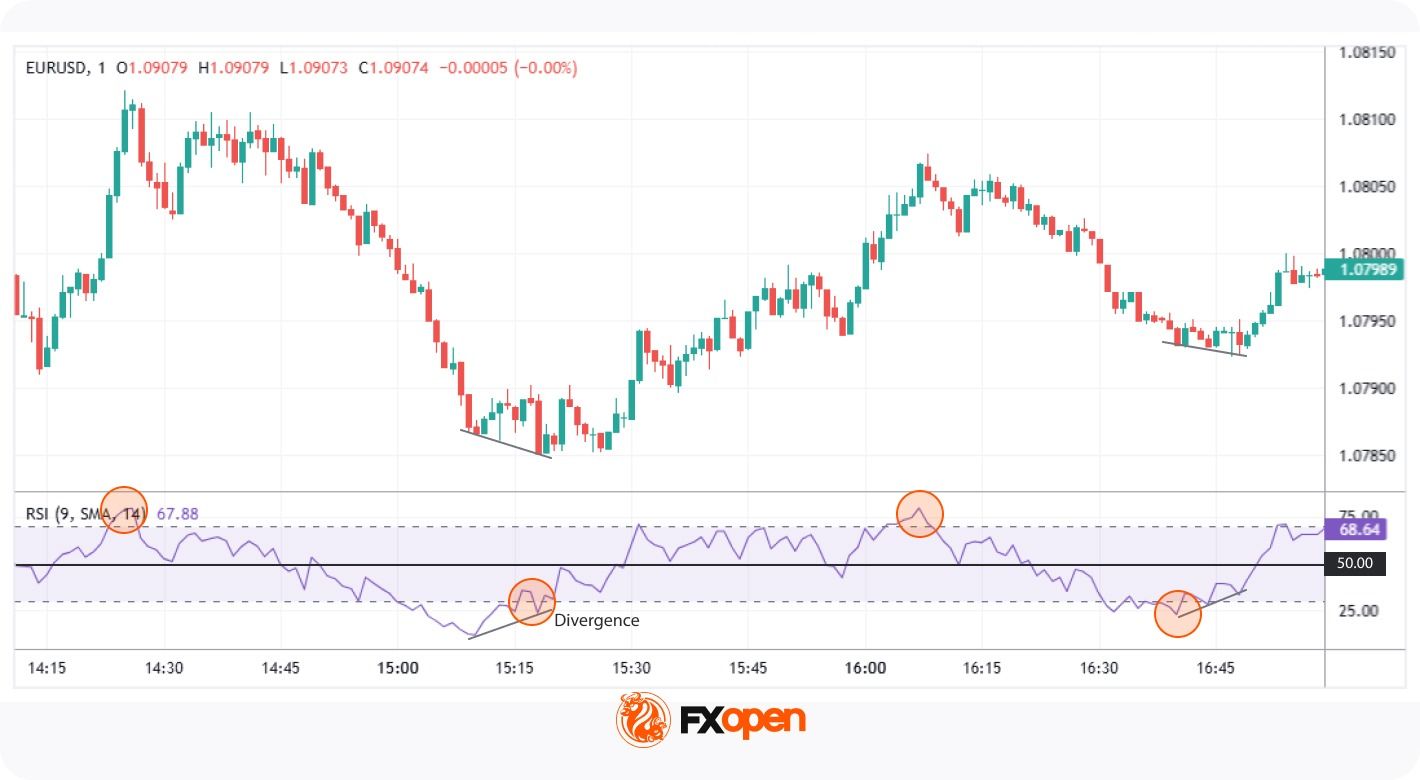
Relative Strength Index (RSI) in Scalping
The Relative Strength Index (RSI) is a well-known scalping indicator that measures the speed and change of price movements, oscillating between 0 and 100. Traditionally, an RSI above 70 indicates overbought conditions, while below 30 suggests oversold conditions.
In scalping, traders often adjust the RSI from its typical length of 14 to shorter periods, such as 7 or 9, to capture rapid price swings occurring over minutes. This adjustment makes the RSI more sensitive to recent price changes, providing timely signals for quick trades. Shorter RSI scalping settings between 2 and 6 periods are also commonly used on very fast timeframes.
Applying RSI in Scalping
- Overbought/Oversold Levels: When the RSI moves beyond 70 or drops below 30, traders watch for potential reversal points. However, scalpers may focus on the RSI’s movement back into the 30-70 range as an early sign of momentum shifting.
- Divergences: Scalpers also look for divergence between price movement and the RSI. For example, if the price reaches a new high but the RSI does not, it may signal a weakening trend and possible reversal. This divergence may support traders in anticipating quick market shifts.
- Midpoint (50 Level): The 50 level serves as a midpoint, indicating the balance between gains and losses. An RSI crossing above 50 may suggest bullish momentum, while dropping below 50 can indicate bearish momentum. Scalpers use this midpoint to assess the prevailing market trend.
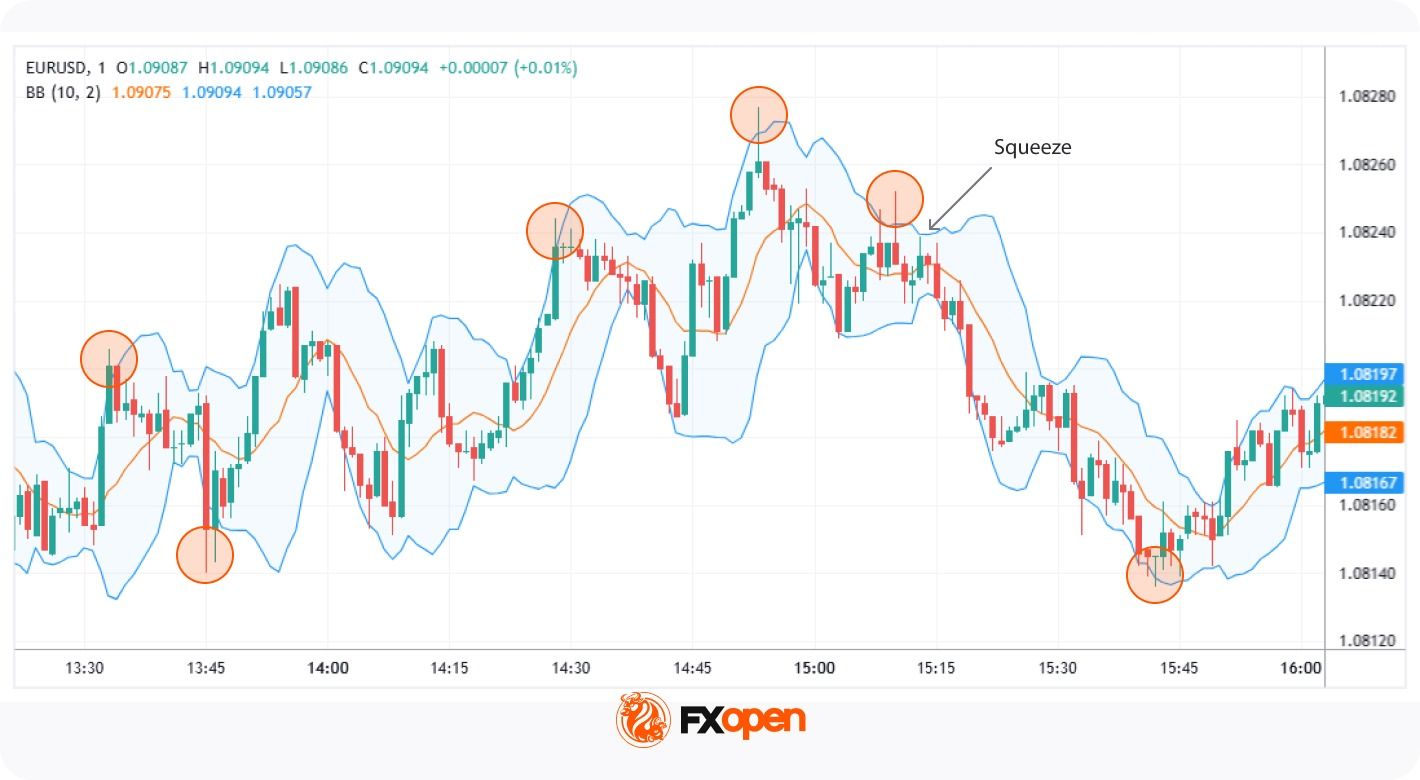
Bollinger Bands
Bollinger Bands are a technical analysis tool comprising three lines: a simple moving average (SMA) in the middle, with upper and lower bands set at a specified number of standard deviations from the SMA. These bands expand and contract based on market volatility, providing a visual representation of price fluctuations. Squeeze conditions, where the bands narrow sharply, often precede expansion and stronger directional moves.
In scalping, traders often adjust Bollinger Bands scalping parameters to shorter timeframes, such as 1-minute or 5-minute charts, to capture quick price movements. A common approach involves setting the SMA period to 7-10 and the standard deviation to 1.5-2, potentially enhancing sensitivity to short-term market changes.
Applying Bollinger Bands in Scalping:
- Bollinger Squeeze: When the bands contract, indicating low volatility, it often precedes significant price movements. Scalpers watch for a breakout above or below the SMA. When the price breaks above the SMA, it may signal that the price will rise, and vice versa.
- Reversal: Price breaching the upper band may suggest overbought conditions, while below the lower band may indicate oversold conditions. Scalpers use these signals to anticipate potential price reversals.
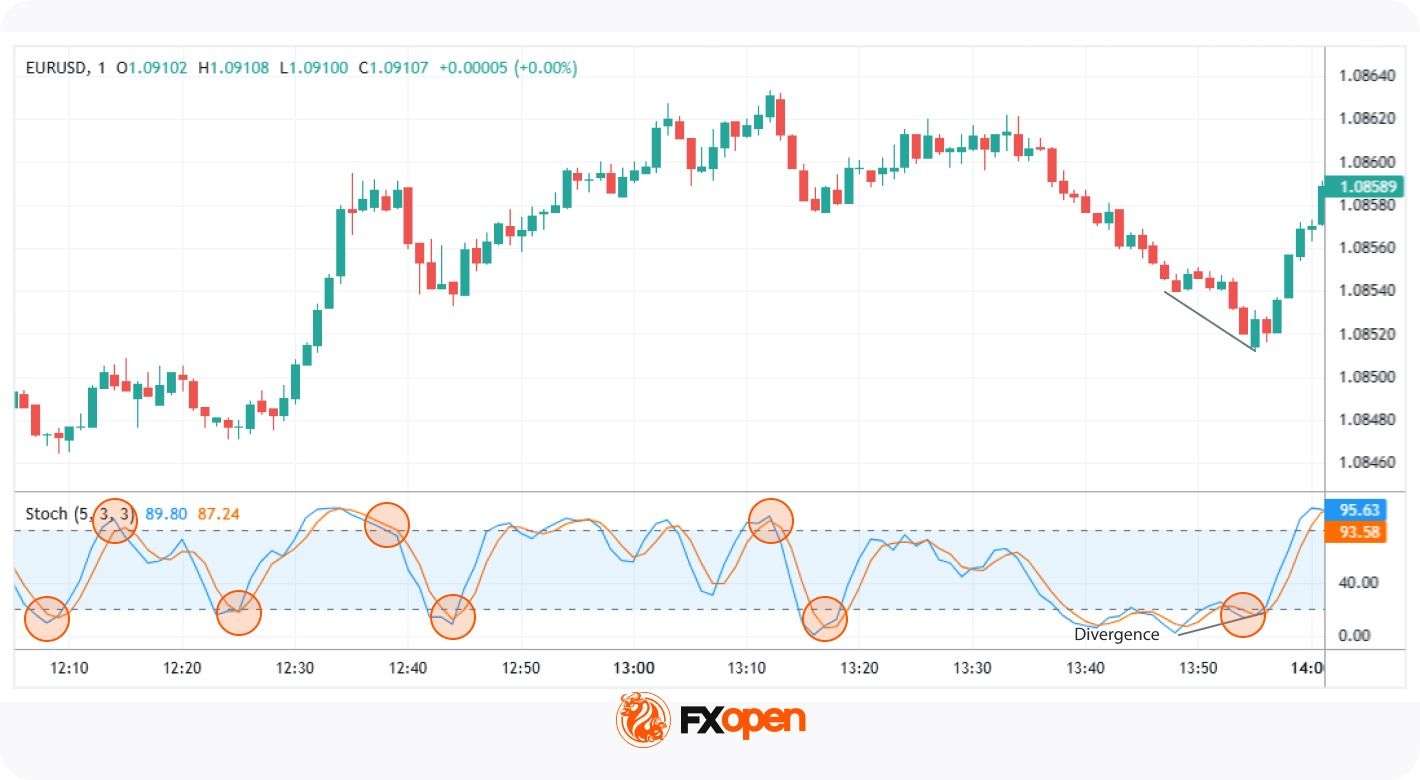
Stochastic Oscillator
The Stochastic Oscillator is a momentum indicator that compares an asset’s closing price to its price range over a specific period, typically 14. It includes the %K line, the current closing price relative to the range, and the %D line, a moving average of %K. The scale runs from 0 to 100, where readings over 80 suggest overbought levels, and those under 20 point to oversold levels. The Stochastic Oscillator is more popular in range-bound markets than in strong trends.
In scalping, traders may adjust the Stochastic Oscillator to shorter settings, such as 5,3,3, to increase sensitivity to rapid price movements. This adjustment may help in capturing short-term market fluctuations.
Applying the Stochastic Oscillator in Scalping:
- Overbought and Oversold Conditions: When the %K line crosses the %D line in the overbought (above 80) or oversold (below 20) zones, it can signal a potential reversal. Scalpers use these crossovers as quick alerts for shifts in momentum, helping them to act swiftly in volatile markets.
- Crossovers: Besides extreme conditions, traders also monitor crossovers between %K and %D. A %K line crossing above %D from a lower level can suggest an upward move, while a downward crossover may hint at a short-term price decline.
- Divergence: If the price makes a new high/low but the Stochastic Oscillator does not, it may signal a weakening trend, indicating a potential reversal.
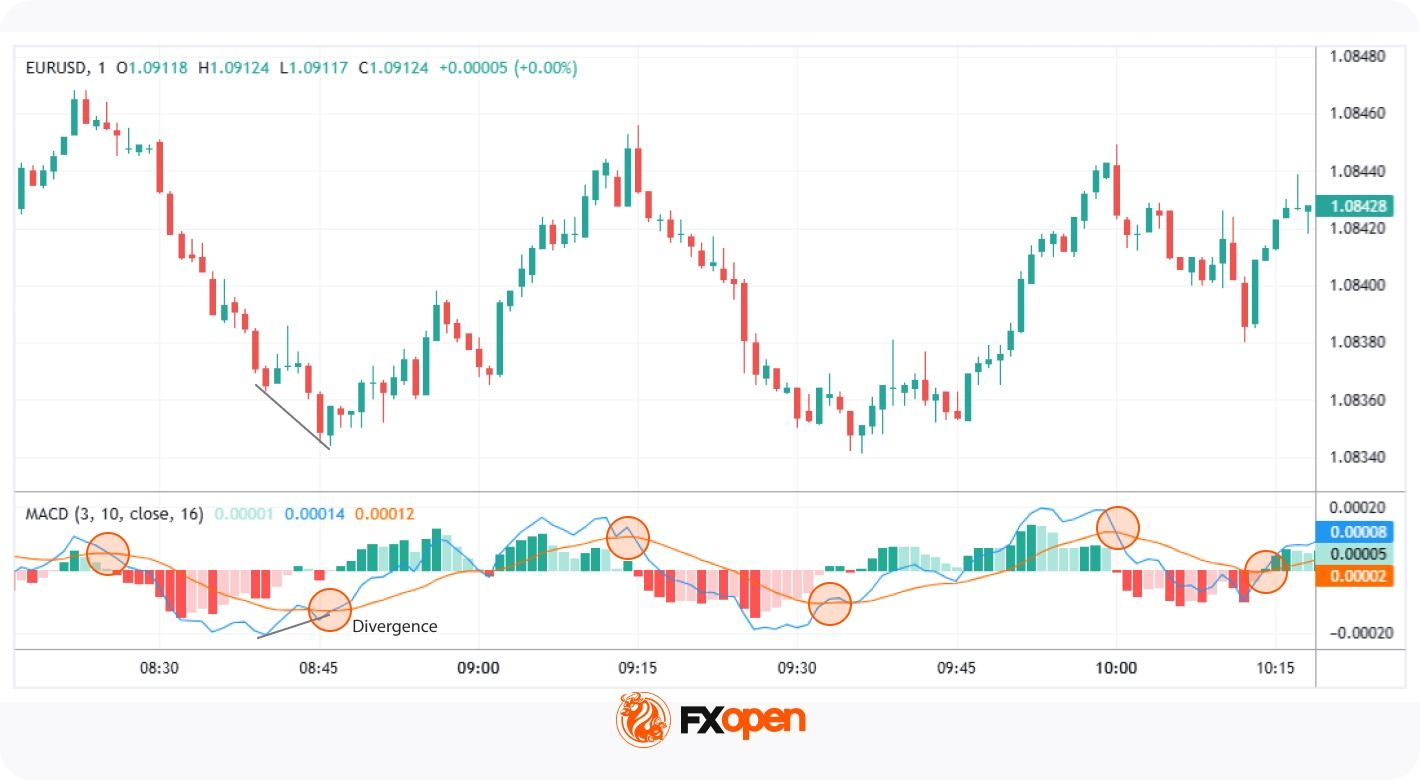
Moving Average Convergence Divergence (MACD)
The Moving Average Convergence Divergence (MACD) is a widely used scalping indicator. It’s a momentum indicator that reflects the relationship between two moving averages. It comprises the MACD line (the difference between the 12-period and 26-period exponential moving averages), the signal line (a 9-period EMA of the MACD line), and a histogram, which illustrates the gap between the two lines.
Scalpers prefer to adjust these settings to 3, 10, and 16, respectively, to make the MACD more responsive to rapid price movements.
Applying MACD in Scalping:
- Crossovers: When the MACD line crosses above the signal line, it may indicate bullish momentum; a crossover below suggests bearish momentum. Scalpers monitor these crossovers to identify potential entry and exit points.
- Histogram Analysis: The histogram represents the difference between the MACD and signal lines. Histogram contraction in the MACD scalping indicator may reflect weakening momentum, while expansion tends to indicate momentum building in the prevailing direction. Scalpers use these changes to gauge the intensity of price movements.
- Divergences: A divergence occurs when the price moves in one direction while the MACD line moves in the opposite. For example, if the price reaches a new low but the MACD does not, it may reflect a potential upward reversal. Scalpers watch for such divergences to anticipate shifts in market direction.
Indicator Confluence in Scalping
Confluence refers to combining signals from multiple indicators to potentially filter noise and improve signal reliability. Each indicator offers unique insights, and their combined use may help filter out false signals. Here are some pairings:
- EMA + RSI → trend direction plus momentum confirmation: Utilising the Exponential Moving Average to identify trend direction alongside the Relative Strength Index to gauge momentum may help traders confirm the strength of a trend before making decisions. For instance, if the EMA indicates an uptrend and the RSI is above 50, it may suggest strong bullish momentum.
- Bollinger Bands + Stochastic → volatility plus reversal signals: Bollinger Bands measure volatility, while the Stochastic Oscillator identifies overbought or oversold conditions. When prices touch the upper or lower bands and the Stochastic Oscillator reflects overbought or oversold conditions, it may indicate potential reversal points.
- MACD + RSI → momentum confirmation across two indicators: The Moving Average Convergence Divergence (MACD) highlights momentum changes, and the RSI indicates overbought and oversold conditions. Using them together can support traders in confirming potential entry or exit points. For example, if the MACD shows bullish momentum and the RSI is rising but not yet overbought, it may signal the price will rise.
Indicator Settings Commonly Used in Scalping
The table below summarises typical scalping configurations for each indicator covered above. These are the settings traders most often apply on these indicators for 1-minute trading and 5-minute trading.
Market Conditions and Indicator Behaviour
Indicator readings shift in reliability depending on the underlying market environment. No single tool performs identically across trend, range, and low-volatility conditions.
In trending markets, the EMA and momentum indicators such as MACD tend to dominate. Trend-following signals carry more weight when price moves directionally with sustained pressure.
In range-bound markets, oscillators become more relevant. The Stochastic Oscillator and RSI often produce cleaner reversal signals when price oscillates between defined support and resistance levels. Moving average crossovers may generate frequent false signals in these conditions.
Under low-volatility conditions, signals across all indicator types weaken. Bollinger Bands contract, momentum readings flatten, and crossovers lose meaning. Traders often wait for volatility expansion before acting on indicator-based setups.
Limitations of Indicators in Scalping
Scalping with indicators offers valuable insights, but there are some challenges traders should be aware of:
- False Signals: Rapid market movements can trigger misleading signals, causing traders to act prematurely.
- Overtrading: Relying too heavily on short-term indicators can lead to excessive trades, increasing transaction costs.
- Market Noise: High volatility and frequent price fluctuations can make it difficult to distinguish genuine trends from random market “noise.”
- Lagging Indicators: Some indicators may react too slowly, causing traders to miss potential trades.
- Tuning: Tuning indicators may be necessary to optimise performance. Academic research has tested indicators such as MACD and RSI across multiple developed markets, with results varying by index, period, and parameter settings.
Key Takeaways on Scalping Indicators
Scalping relies on precise and timely decisions, which is why technical indicators play an important role in this trading style. Tools such as moving averages and oscillators provide structured signals that may support traders in navigating fast market movements. The choice of indicators varies depending on individual trading preferences, market conditions, and timeframes.
If you want to test the above-mentioned indicators or find something new for yourself, you can open an FXOpen account to access over 700 markets and trade with tight spreads from 0.0 pips.
FAQ
What Indicators Are Used for Scalping?
Common scalping indicators include the Exponential Moving Average (EMA), Relative Strength Index (RSI), Bollinger Bands, Stochastic Oscillator, and Moving Average Convergence Divergence (MACD). The Hull Moving Average is also used by some traders. Each tool serves a different function across trend identification, momentum measurement, and volatility assessment on short-term charts.
What EMA Settings Are Used in Scalping?
Common EMA settings for scalping include 5, 9, and 20 periods on 1-minute and 5-minute charts. Traders often pair a fast EMA, such as 5 or 9, with a slower EMA, such as 15 or 20, to monitor crossovers. Shorter periods react faster but may produce more false signals.
Can RSI Be Used for Short-Term Trading?
Yes, the RSI is popular among short-term trading indicators. Scalpers typically reduce the RSI period from the standard 14 to between 2 and 7 to capture rapid price swings. Traders watch for crosses above 70 or below 30, divergences with price, and movement around the 50 midpoint.
How Do Bollinger Bands Work in Scalping?
In scalping, traders often use a 7 to 10 period SMA with 1.5 to 2 standard deviations. Squeeze conditions may precede breakouts, while band touches may indicate reversal zones.
Do Indicators Behave Differently in Trending and Ranging Markets?
Yes, indicator reliability shifts with market conditions. In trends, momentum indicators such as MACD and EMAs tend to perform more consistently. In ranges, oscillators such as RSI and Stochastic produce cleaner reversal signals. Under low volatility, signals across all indicator types tend to weaken.
What Is the 1-Minute Scalp Strategy?
The 1-minute scalp strategy involves making rapid trades on a 1-minute chart. Traders look for small price movements and enter multiple trades within a short period, often using scalp trading indicators like the EMA or RSI for quick signals.
What Is the 5-Minute Scalping Strategy?
The 5-minute scalping strategy focuses on capturing short-term price movements on a 5-minute chart. Traders typically combine trend and momentum indicators, like the MACD and Bollinger Bands, to make fast, informed decisions.
Are There Good Stocks for Scalping?
The choice depends on the trader’s risk tolerance, trading approach, experience, and toolkit. However, according to theory, stocks with high liquidity, tight spreads, and significant daily volume are good for scalping. Popular choices include tech giants like Apple (AAPL) and Tesla (TSLA), as they offer frequent price fluctuations. But at the same time, they bear higher risks.
This article represents the opinion of the Companies operating under the FXOpen brand only. It is not to be construed as an offer, solicitation, or recommendation with respect to products and services provided by the Companies operating under the FXOpen brand, nor is it to be considered financial advice.
Source link