What Is A Follow-Through Day?
Contents
The term “follow-through day” is broad enough that different traders and analysts have different definitions.
For today’s example, we are going to use a modernized interpretation of William O’Neil’s concept, which he wrote about in his seminal book.
How to Make Money in Stocks was first published in 1988.
Quoted from the book, he writes…
“A follow-through day should give the feeling of an explosive rally that is strong, decisive, and conclusive, not begrudging and on the fence, up only a marginal eight or nine points”.
Once an investor has withdrawn some or all of his money from the market due to a declining trend, the question of when to get back into the market is a tricky one.
If an investor gets back in too soon, the rally could turn out to be a head-fake, “whipsaw,” or “dead cat bounce” instead of a true reversal of the trend.
If an investor gets back into the market too late, he will miss out on some gains.
The follow-through day is used to detect a reversal back to the uptrend after a downtrend.
It was this technique that O’Neil used to decide when to get back into the market after getting out due to the Cuban Missile Crisis.
He writes…
“By October 1962 and the Cuban crisis, I was again in cash. A day or two after the Russians backed down from President Kennedy’s naval blockade, on the first follow-through day in the Dow Jones, I bought the first stock of the new bull market.”
This is not to say that the appearance of the “follow-through day” will always lead to an uptrend.
Most of the time it does, but sometimes it may fail.
However, O’Neil believes that all bull markets begin with the appearance of a follow-through day.
The follow-through day signals when major institutional investors are stepping back into the market, as seen through the price action of a leading index.
Institutional investors, including mutual funds, pension funds, and hedge funds, control the vast majority of market volume on any given day.
When these large players begin re-entering the market in size, it creates the kind of sustained buying pressure that can fuel a prolonged uptrend.
A follow-through day is essentially a footprint left by institutions returning to the market en masse. Without their participation, rallies tend to be short-lived and unreliable.
- The index must be in a downtrend.
- Look for “Day 1” of a rally. This is the day when the close is higher than the previous day’s close.
- Look for the rally to be still alive on Day 4. Alive means for each day of the rally, the price never goes below the recent low. Otherwise, start over.
- If Day 4 or later has a gain of more than 1.5% from close to close, and it did so on heavier volume than the previous day, then it is a follow-through day.
- If the follow-through day occurs after Day 10, the rally is considered weak.
The technique is meant to be applied to the major indices such as the S&P 500, Nasdaq, and Dow Jones Index.
If institutions are getting back into the market, they would be investing in baskets of stocks rather than just one or two obscure names.
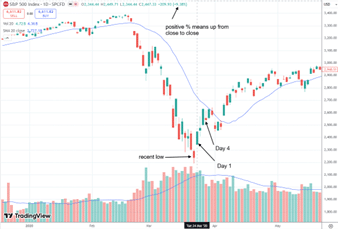
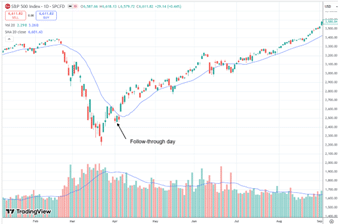
Let’s look at the ticker SPX for the S&P 500 index to see the follow-through day that preceded the 2020 Covid recovery.
We are looking at the daily candlestick chart for a follow-through day.
The market is in a confirmed downtrend in March 2020.
On March 24th, we saw a gap up with a green candle.
The “+9.38%” shown in TradingView indicates that the candle closed 9.38% higher from the previous day’s close.
A positive percentage is all that we are looking for when we look for “Day 1”, the first day of a rally attempt.
At this stage, it does not matter how much the gain is or what the volume is.
Now that we have determined that March 24th is Day 1, we aim to ensure that the prices on subsequent days do not undercut the recent low.
The recent low is the potential “bottom” of the downtrend.
If any price, including intraday, falls below 2191.86, the rally has failed, and we start all over.
Day 2 and Day 3 kept the rally alive because prices never went below the recent low.
We now look at Day 4 as potentially being the follow-through day.
We do not consider Day 2 or Day 3 follow-through days because we want a sustained rally, not just a quick, short-squeeze rally.
For Day 4 to be a follow-through day, the gain from its close to the close of the previous day must be more than 1.5%, and it must have higher volume than the previous day.
In O’Neil’s original book, he says 1% gain.
But now that market volatility has increased since the time of that book’s writing, the modernized rule would require a gain of at least 1.5%.
The larger the gain, the better the indication of follow-through.
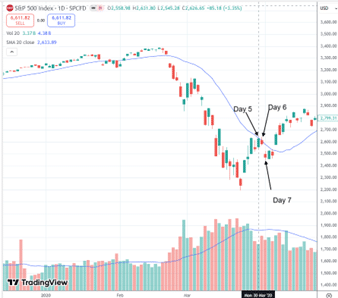
In this case, Day 4 is not a follow-through day because it closed below the previous day’s close.
It was not even a gain.
Day 5 (see chart below) closed above the previous day’s close and posted a +3.35% gain from close to close…
While it met the criteria for price gain, its volume did not exceed Day 4’s volume.
Hence, it is not a follow-through day.
Day 6 did not have a positive gain.
And Day 7 gapped down.
Neither invalidated the rally since they did not go below the recent low.
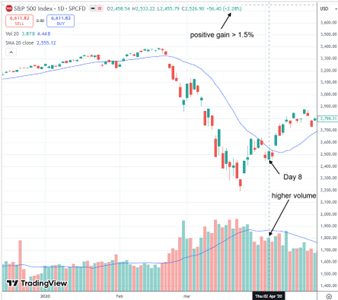
Day 8 on April 2nd, 2020, meets the criteria of being the follow-through day…
It closed above the previous day’s close by 2.28%, which is greater than 1.5%, and its volume is larger than the previous day’s volume.
After that, a beautiful uptrend ensued.
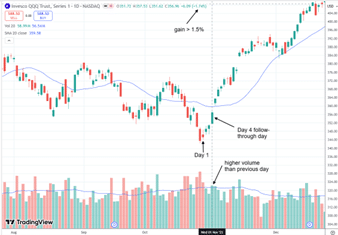
The index for the Nasdaq 100 is NDX.
But we can also use QQQ as a proxy, since it closely tracks the NDX.
In the below QQQ daily chart…
We see that November 1st, 2023, was a follow-through day that sparked an uptrend after the post-summer correction.
It was Day 4 of the rally, with a gain of +1.74% from close to close, on higher volume.
Look at Day 1.
It is a red candle.
That does not matter.
It closed above the previous day’s close.
That is the only criterion for Day 1.
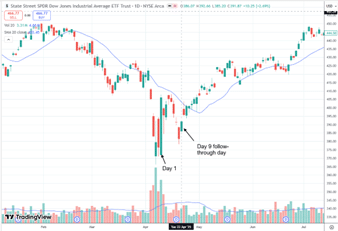
The market was in a downtrend in April 2025, coinciding with the U.S. Administration’s tariff policies.
Using DIA as the proxy for the Dow Jones Industrial Average, we see that April 22nd, 2025, was a follow-through day.
The big green candle on April 9th is Day 1 of the rally because it is the first day to close above the previous day’s close after the recent low.
The green candle on Day 9 of the rally met the criteria of a follow-through day.
It is the first candle after Day 3 of the rally that closed with a gain greater than 1.5% and on heavier volume.
Investors adopting this method now have greater confidence that the low is in place and can step back into the markets.
Not every follow-through day leads to a lasting uptrend.
O’Neil himself acknowledged that roughly one in five follow-through days can fail.
Traders should be aware of several scenarios that reduce reliability.
If implied volatility remains elevated throughout the rally attempt, it can indicate persistent fear and a greater chance of failure.
Likewise, a follow-through day that occurs on extremely light volume overall, even if heavier than the previous day, should be treated with caution.
Volume context matters.
Comparing the follow-through day’s volume to a 50-day average provides a more robust gauge of institutional commitment than a simple day-over-day comparison.
Finally, if the follow-through day occurs very close to major resistance levels such as prior highs or key moving averages, the probability of the uptrend stalling increases.
Always combine the follow-through day signal with broader market condition metrics before committing significant capital.
Options traders can benefit significantly from the follow-through day concept.
When a confirmed follow-through day is identified, traders may consider bull call spreads or bull put spreads to express a bullish view with defined risk.
These strategies allow participation in the anticipated uptrend while capping maximum loss, which is important given that not all follow-through days succeed.
For traders already holding a diversified options portfolio, a follow-through day may also be a signal to loosen hedges or reduce portfolio protection by reducing the number of puts placed during the downtrend.
The timing of reducing downside protection is just as important as establishing it in the first place.
For a visual walkthrough of identifying high-probability market setups, watch High Probability Option Trading: Maximize Your Win Rate on the Options Trading IQ YouTube channel.
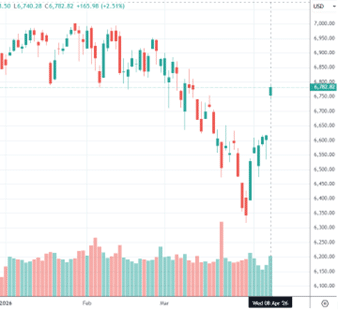
It’s easy to spot this pattern when viewing the entire chart in hindsight.
But it’s much harder when you’re on the hard-right edge, watching the market unfold in real time.
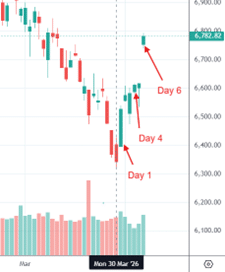
The chart below shows the market as it stood just after it closed on Wednesday, April 8th, 2026.
As a quick quiz to test your understanding, decide whether that day qualifies as a follow-through day.
Answer:
The market was in a downtrend with the lowest candle so far on March 30th as a potential bottom.
The next step is to see whether the following day, March 31st, closes above the prior day’s close.
It did, which makes March 31st Day 1 of a potential rally.
Days 2 and 3 don’t require special attention as long as the price does not undercut the March 30th low.
On Day 4, we check for a follow-through day.
Day 4 is not a follow-through day; it does not qualify because its volume is lower than the previous day’s.
Day 5 also fails to qualify.
Although the volume is higher, the price gain from close to close is less than the required 1.5%.
Day 6 on April 8th opens with a gap-up and delivers a 2.51% gain, well above the required 1.5%.
And it did so with increased volume.
So yes, April 8th is a beautiful follow-through day.
For further reading on position sizing as you re-enter the market after a follow-through day, be sure to manage risk carefully as you build positions.
We hope you enjoyed this article on identifying and trading the follow-through day.
If you have any questions, send an email or leave a comment below.
Trade safe!
Disclaimer: The information above is for educational purposes only and should not be treated as investment advice. The strategy presented would not be suitable for investors who are not familiar with exchange traded options. Any readers interested in this strategy should do their own research and seek advice from a licensed financial adviser.

Source link